Whitepaper · Series VI

The Variety Gap

What We Don’t Optimize For, We Lose the Ability to See

Context

Every governance system operates under an explicit or implicit objective function. That function selects which dimensions of reality the system attends to — and, by omission, which it cannot perceive. Treating objective functions as observation architectures, this paper shows that low‑dimensional value functions produce the same structural collapse as low‑dimensional governance channels: the excluded dimensions eventually re‑enter as unresolvable crises.

The paper introduces the variety gap (G) — the mismatch between the dimensionality of reality and the value architecture — as a unifying diagnostic. When G exceeds a critical threshold, the system becomes constitutionally blind to existential threats. Long‑run viability requires not just better metrics but an enduring capacity for value evolution.

Abstract

Every governance system operates under an explicit or implicit objective function. That function selects which dimensions of reality the system attends to, which deviations it corrects, and — critically — which signals never reach the decision layer. This paper treats objective functions as observation architectures. Drawing on Ashby’s Law of Requisite Variety (Ashby, 1956) and the control‑theoretic results of the Governance as Engineering series, it shows that low‑dimensional value functions produce the same structural collapse as low‑dimensional governance channels: the excluded dimensions eventually re‑enter as unresolvable crises.

Introduces the variety gap (G)—the mismatch between the effective dimensionality of reality and the dimensionality of the value architecture—as a unifying diagnostic. The gap is defined formally (Appendices A–B) and operationalized through measurement protocols (Appendix G), though empirical application of those protocols remains future work. When G exceeds a critical threshold, the system becomes constitutionally blind to the threats it most needs to perceive (Conant & Ashby, 1970; Shannon, 1948). The argument proceeds in three explicit layers: a rigorous cybernetic core, an interpretive application to national governance failures, and a bounded philosophical extrapolation to the meta‑governance of value itself.

Long‑run civilizational viability, the paper argues, requires not merely higher‑dimensional value architectures but an enduring institutional capacity for open‑ended value evolution — an asymptotic approach toward full reality‑integration that no finite system can complete (Beer, 1972; Kauffman, 2000).

Contributions

  • Establishes objective functions as observation architectures, uniting optimization theory, control theory, and epistemology (Goodhart, 1975; Conant & Ashby, 1970).
  • Formulates the Goodhart‑Ashby synthesis: any objective function with dimensionality lower than system variety eventually degrades its own ability to perceive the system’s true state (Manheim & Garrabrant, 2018).
  • Introduces the variety gap (G) as an operationalizable metric for systemic blindness and collapse risk.
  • Demonstrates the framework’s potential explanatory scope through country case studies re‑interpreted as variety‑gap crossings (Governance as Engineering Series; Gilens & Page, 2014; FAO, 2022). These re-interpretations are consistent with the framework but do not constitute independent validation.
  • Articulates the meta‑governance imperative: designing institutions that can consciously evolve their own value architectures before G becomes fatal (Beer, 1979; von Foerster, 1984).


Part I — The Engineering Grammar and Its Generalization

Before we can argue that what a system optimizes for determines what it can see, we must establish a more fundamental principle: that the structure of observation — how information is gathered, aggregated, and transmitted — places hard limits on what any controller can accomplish, regardless of its intentions, resources, or competence. That principle is the backbone of the Governance as Engineering series, which applies control theory and cybernetics to institutional design (Wiener, 1948), and it generalizes naturally from the design of institutions to the design of the values those institutions serve.

1.1 Four Failure Modes, One Mechanism

The Governance as Engineering series models governance systems as feedback control loops. Five papers demonstrate, across four distinct domains, that a single mechanism drives structural governance failure: aggregation destroys information. When a central controller observes only a summary — a national average, an aggregated preference poll, an annual stock estimate — it loses the spatial, temporal, and distributional detail needed to respond appropriately to the real, distributed system it governs. The destroyed information cannot be recovered downstream. No amount of institutional quality, deliberative sophistication, or enforcement capacity can act on a signal that never arrived (Shannon, 1948; Conant & Ashby, 1970).

The series identifies four characteristic failure modes, each a manifestation of this same underlying dynamic:

  • Spatial blindness (Paper I): A controller observing only the system-wide mean cannot distinguish a severe local crisis from a mild system-wide fluctuation. Its delayed, uniform response arrives too weak for the distressed node and disrupts the healthy ones — the “averaging problem.”
  • Frequency gaps (Paper II): A controller with a single response latency cannot stabilize disturbances across all timescales simultaneously. Fast shocks outrun it; slow drifts are invisible to its short observation window. No single‑scale architecture covers the full disturbance spectrum.
  • Preference invisibility (Paper III): Representation chains deeper than two or three layers destroy the variance of citizen preferences. Noise overwhelms signal; the policy layer governs a phantom — responding to the noise structure of its own representation machinery rather than to what citizens actually want.
  • Observational inadequacy (Paper IV): Governance systems that monitor a complex renewable resource through a single aggregate dimension (e.g., total biomass) cannot detect the fast, medium, and slow disturbances that drive resource dynamics. The unobserved variety appears as uncontrolled variance — often accelerating collapse (Ostrom, 1990; Ashby, 1956).

Critically, these failure modes do not merely add; they compound. Paper V demonstrates the coordination failure tax: when multiple structural defects coexist, the effective governance capacity is not the sum of individual losses but their product. A system exhibiting all four failure modes simultaneously is, in an informational sense, categorically incapable of the functions it claims to perform.

1.2 The Unified Principle

Across every domain examined, the same logic holds: an observation channel reduces the dimensionality of the information it transmits. The information that is lost is the information that was specific — local, temporal, distributional, dimensional. Once discarded, it cannot be reconstructed at the receiving end. Institutions, no matter how well‑designed, operate on the signal that survives the channel. If that signal has been stripped of the very dimensions required to detect and respond to a given disturbance, institutional quality is powerless to close the gap.

This is not a political claim. It is a structural constraint that follows from the mathematics of control theory, information theory, and Ashby’s Law of Requisite Variety: only variety can absorb variety. A controller whose internal variety — the range of distinguishable states it can recognize and respond to — is lower than the variety of the system it governs cannot stabilize that system (Ashby, 1956). The excluded variety becomes uncontrolled variance in the outcomes, appearing as crises that the controller did not see coming and cannot explain.

1.3 From Governance to Value

The series’ formal results focus on governance institutions: where information is aggregated, how quickly it flows, who makes decisions. But the same mechanism operates one level up. A governance system’s objective function — what it explicitly optimizes for, values, or treats as success — is itself an observation architecture. It defines the dimensions of the world that are operationally relevant and, by omission, consigns the rest to noise.

When a society optimizes for GDP, it does not merely prioritize economic output. It constructs an information system that renders economic transactions highly visible while rendering unpaid care, ecosystem health, social trust, and existential meaning structurally invisible (Stiglitz, Sen, & Fitoussi, 2009; Raworth, 2017). The objective function is the filter. It selects which states are recognized as deviations to be corrected, and which are not. The dimensions that fall outside the optimization space become, in control-theoretic terms, unobservable — and, eventually, ungovernable. They accumulate as externalities until they breach the system’s stability thresholds, at which point they reappear as crises for which the system has no sensor and no vocabulary.

This is the paper’s foundational move: to treat optimization functions not merely as expressions of preference, but as architectural choices that determine the perceptual boundaries of the system. The failure modes identified in the engineering series — spatial blindness, frequency gaps, preference invisibility, observational inadequacy — are not unique to bureaucratic structures. They are general properties of any system that compresses a complex, high‑dimensional reality into a lower‑dimensional signal for the purpose of control. What a system optimizes for is what it compresses into its control channel. The compression loss is what it eventually becomes unable to see.

The remainder of this paper formalizes this insight. Part II develops the structural identity between objective functions and observation architectures. Part III introduces the variety gap as a unifying diagnostic and models its dynamics. Parts IV and V apply the framework to the missing dimensions of social and ecological value and to the country case studies that ground the argument. Part VI explores the meta‑governance imperative: the necessity of institutions that can consciously evolve their own value architectures. Throughout, we distinguish the rigorous core from interpretive extensions and philosophical extrapolation, so that the argument’s foundations remain visible.


Part II — The Optimization Turn: Value Functions as Observation Architectures

Part I established that aggregation destroys information and that institutional quality cannot restore what the observation channel discards. That argument was made about governance systems — institutions that gather data, make decisions, and act. But the same architecture operates at the level of values. Every governance system embodies, explicitly or implicitly, a set of objectives. Those objectives determine what counts as a signal, what counts as noise, and which dimensions of reality the system is structurally capable of attending to. This part formalizes that insight: an objective function is not merely a statement of preference. It is an observation architecture.

2.1 The Structural Identity

Consider any controller — a thermostat, a central bank, a ministry — that attempts to stabilize a system in the presence of disturbances. For it to act, it must receive information about the system’s state. The observation channel y = Cx + ε maps the true state x into the measured signal y, with matrix C selecting which dimensions are observed and noise ε corrupting the transmission (Shannon, 1948). The controller acts on y, not x. The dimensions of x that are not projected through C are invisible to it, regardless of their causal importance.

Now consider an objective function — GDP maximization, shareholder value, ideological purity, electoral victory, or a multidimensional set of wellbeing indicators. The objective function defines a value space V into which the system’s vast state space R is projected. Only those dimensions of R that map onto V are operationally relevant: they are the states that appear as deviations from the goal, as costs to be minimized, or as targets to be approached. The mapping from R to V is, structurally, an observation channel. It is a matrix that selects which aspects of reality the system sees as mattering.

The identity is not metaphorical. In both cases, a high-dimensional state space is compressed into a lower-dimensional signal. Information is lost. The controller — whether a governance institution or the optimizing logic of a whole civilization — acts on the compressed signal. If a causally relevant dimension of R lies in the nullspace of the value projection, that dimension is functionally invisible. It becomes part of the system’s unobservable subspace. The controller does not respond to it, not because it chooses to ignore it, but because its own architecture has rendered it imperceptible.

This is the foundational claim: an objective function is an observation architecture. What a system optimizes for determines what it can perceive. The choice of value metric is, simultaneously, the choice of blindness. Conant and Ashby (1970) proved that every good regulator of a system must possess a model of that system. The corollary is that a regulator whose internal model excludes causally relevant dimensions is, in those dimensions, not a regulator at all — it is a blind actuator.

2.2 The Dimensionality of a Value Function

If objective functions are observation architectures, then we can characterize them by the same properties we use for any observation channel: dimensionality, aggregation structure, and temporal horizon.

The dimensionality of a value function is the number of independent state dimensions it tracks. A GDP objective is one‑dimensional: the vast multiplicity of human activities — care, creativity, ecosystem maintenance, social trust, leisure, illness — is projected onto a single monetary axis (Stiglitz, Sen, & Fitoussi, 2009). A shareholder‑value objective is one‑dimensional: all corporate activity is compressed into equity price. An authoritarian stability objective is one‑dimensional: all social phenomena are measured against their proximity to or deviation from regime continuity.

Operational specification: How do we count dimensions? Appendix G provides three protocols of increasing rigor: (1) enumerating independent policy objectives from official documents, (2) principal component analysis on time-series policy data, (3) information-theoretic compression ratios. The first is feasible but approximate; the second and third are “in principle” protocols not yet implemented. Throughout this paper, unless otherwise noted, dimensionality estimates use Protocol 1 (objective counting) applied heuristically. A GDP-only objective is dim(V) ≈ 1 not because we have measured it precisely, but because only one independent axis of variation is tracked in policy decisions.

A multi‑objective function — say, the United Nations’ Sustainable Development Goals with their 17 goals and 169 targets — is higher‑dimensional but introduces a different structural tension. The dimensionality is not simply the count of indicators but the effective dimensionality: how many independent degrees of freedom the value architecture can distinguish and trade off. If all indicators are subordinated to a single ultimate metric (e.g., growth), the effective dimensionality collapses (Raworth, 2017). Weaver (1948) distinguished three kinds of problems: simple (few variables), disorganized complexity (many variables amenable to statistical treatment), and organized complexity (many variables with structured interdependencies). Most governance systems face organized complexity, yet their value architectures are often designed for simplicity.

The aggregation structure describes how the value function compresses local, distributed states into a global summary. GDP is an extreme aggregator: the economic activity of a continent is expressed as a single number. None of the variance within is perceptible to the metric. The temporal horizon — the discount rate — determines which future states are visible and which are not. A steep discount rate renders the distant future effectively unobservable: its states register no meaningful signal in the value function, just as a low‑pass filter removes high frequencies from a sensor reading.

A single‑metric objective function with high aggregation and steep discounting is, in signal‑processing terms, a narrowband, low‑dimensional observation channel. It is structurally incapable of registering the full variety of the system it is meant to guide. Whatever is true about the world but absent from that metric might as well not exist — until it produces a disturbance that cannot be ignored.

2.3 Requisite Variety for Value Architectures

Ashby’s Law of Requisite Variety (Ashby, 1956) states that a controller can only stabilize a system if its internal variety — the number of distinct states it can discriminate and respond to — matches or exceeds the variety of the disturbances the system faces. Formally, for a disturbance space D and a goal set G, the controller’s variety V(R) must satisfy V(R) ≥ V(D) − V(G). If the controller’s variety is insufficient, the unabsorbed variety appears as uncontrolled variance in the outcomes.

This law was formulated for physical and biological controllers — thermostats, nervous systems, organizational regulators. But the same logic applies directly to value architectures. The “controller” is the set of objectives that select which disturbances are attended to and which are not. Its variety is the dimensionality of the value function — the number of independent state dimensions it can distinguish and prioritize. The “disturbance space” is the full range of environmental, social, and internal variation that can push the system away from its desired states.

The extension follows: a value architecture must possess at least as much dimensionality as the disturbance space it must govern, minus the dimensionality of acceptable outcomes. dim(V) ≥ dim(D) − dim(G). If this condition is violated, there exist disturbance dimensions that the value function cannot register. Those disturbances are, in the formal sense, unobservable to the optimizing logic of the system. They accumulate as externalities — unpriced, unmeasured, unaccounted — until they breach thresholds that force themselves into visibility through crisis.

This is not a normative claim. It is a structural prediction. A system that optimizes for a one‑dimensional variable in a multi‑dimensional world will be blindsided by the excluded dimensions, not because its institutions are incompetent, but because its value architecture lacks the sensory apparatus to detect them in advance. The failures are built into the optimization geometry.

This paper does not insist on a literal, precise measurement of dim(R) and dim(V) — such measurement is an open research problem, and the terms are used heuristically here. Formal attempts at operationalization are deferred to Appendix B. The conceptual point is that there is a mismatch, that it grows under conditions of rigidity, and that its consequences follow the logic of Ashby’s Law.

2.4 The Goodhart–Ashby Synthesis

Goodhart’s Law, in its canonical formulation, states: “When a measure becomes a target, it ceases to be a good measure” (Goodhart, 1975). The usual interpretation is behavioral: agents game the metric, optimizing their performance against the proxy rather than the underlying reality. This is correct but incomplete.

The deeper mechanism is architectural. When a single metric is elevated to the status of an objective function, the system’s observation channel is narrowed to that metric alone. All the information that formerly made the metric a useful proxy was contained in its correlation with the wider state space — a correlation that depended on the system not optimizing for it exclusively. The moment the metric becomes the target, the system begins optimizing away the very conditions that maintained the correlation. The proxy diverges from the target, not primarily because of gaming, but because the observation architecture has been compressed to the point where the divergence itself is invisible to the metric that would detect it (Manheim & Garrabrant, 2018; Strathern, 1997).

This yields the Goodhart–Ashby synthesis: any objective function with dimensionality lower than the variety of the system it governs will eventually optimize away its own ability to perceive the system’s true state. The proxy collapses not because agents cheat, but because the objective function’s low dimensionality makes the proxy-target divergence an unobservable dimension. The controller continues optimizing the measure, blind to the growing gap, until the gap manifests as a crisis that the measure cannot explain.

The classical examples are economic: inflation-targeting neglecting financial stability; standardized test scores eroding education quality (Strathern, 1997); GDP growth masking ecological degradation. But the logic is domain‑general. An authoritarian regime optimizing for short‑term control loses the ability to perceive the legitimacy that sustains control over the long run. A social media platform optimizing for engagement loses the ability to perceive the epistemic environment it degrades. In each case, the value function’s low dimensionality creates an observational blind spot that eventually destroys the very outcome the function was meant to secure. Müller (2018) provides extensive historical documentation of how metric fixation distorts organizational behaviour across domains — from medicine to education to policing — illustrating the mechanism in practice.

2.5 Related Work

The argument developed here sits at the intersection of several established research traditions, each of which approaches the same territory from a different angle. The present synthesis is novel not in its individual components but in treating objective functions explicitly as observation architectures whose dimensionality is a design variable — and in extending the logic of Ashby’s Law to the architecture of values themselves.

  • Cybernetics and control theory: Ashby’s Law (1956) provides the formal backbone; Stafford Beer’s Viable System Model (1972, 1979) applies cybernetic principles to organizational design, though it stops short of analyzing the value functions those organizations optimize. The present work extends the cybernetic tradition upward, from governance structures to the objectives that animate them.
  • Multi‑objective optimization and Pareto frontiers: The engineering literature on multi‑objective control has long recognized that optimizing for a single metric can produce pathological outcomes. The paper generalizes this insight: the dimensionality of the objective function is an independent structural variable with stability consequences.
  • Ecological economics and sustainability science: The critique of GDP and the call for multidimensional wellbeing metrics — including the Stiglitz-Sen-Fitoussi report (2009), Doughnut Economics (Raworth, 2017), and the Human Development Index — are attempts to increase the dimensionality of value architectures. This paper provides the formal control‑theoretic rationale for why such increases are not merely ethically desirable but structurally necessary for long‑run stability.
  • AI alignment and reward misspecification: The problem of reward hacking in reinforcement learning — where an agent optimizes a proxy reward function and produces unintended, often catastrophic outcomes (Amodei et al., 2016) — is a precise analogue of the value‑function collapse described here. The argument generalizes this from AI systems to institutional and civilizational ones.
  • Complexity theory and evolutionary systems: Stuart Kauffman’s “adjacent possible” (2000), Taleb’s antifragility (2012), and the study of punctuated equilibrium in social systems (Gould & Eldredge, 1977) all point toward the unbounded emergence of novelty in complex environments. The present framework formalizes the governance implication: in an open‑ended disturbance space, value architectures must themselves be open‑ended.
  • Political theory and democratic legitimacy: The deliberative turn in democratic theory — citizens’ assemblies, participatory budgeting (Habermas, 1996; Dryzek, 2000; Ostrom, 1990) — can be re‑interpreted as institutional mechanisms for expanding the dimensionality of the value function by introducing signals the existing architecture cannot detect. The paper provides a structural language for why such mechanisms are not cosmetic but essential to systemic viability.

Part III — The Variety Gap: Dynamics and the Dissolution Threshold

If objective functions are observation architectures, then their adequacy is not a binary condition but a matter of degree — and that degree can shift over time as the environment generates new disturbance dimensions that the existing value architecture was never designed to track. This part introduces the variety gap as a unifying diagnostic, models its dynamics heuristically, identifies the critical threshold where observability collapses, and argues that dissolution — the death or transformation of a value paradigm — is not a pathology but a structural necessity once that threshold is crossed.

3.1 Defining the Gap

Let R denote the effective state space of reality as it bears on a given system’s viability. This is not a claim about metaphysical infinity; it is the set of independent dimensions along which the system can be disturbed — ecological, economic, social, technological, psychological, and so on — at a level of resolution relevant to its survival. The dimensionality of this space, dim(R), is large and, crucially, not static. New dimensions emergently enter the relevant disturbance space over time: climate change introduces a carbon dimension into economic planning; digital media introduce an epistemic integrity dimension into democratic governance; demographic transition introduces a generational justice dimension into fiscal policy. Kauffman (2000) captures this generative property with the concept of the “adjacent possible”: at any moment, new states of the system become reachable that were not reachable before, expanding the effective dimensionality of the space that governance must navigate. From the perspective of any finite governance architecture, the effective dimensionality of reality is open‑ended.

Let V denote the system’s value architecture — the explicit or implicit objective function that selects which states are visible as successes or failures, which costs are counted, and which trade‑offs are permissible. Its dimensionality, dim(V), is the number of independent axes that the value function can distinguish and weight against one another. A system optimizing GDP alone has dim(V) ≈ 1; one balancing multiple wellbeing dimensions has a larger, though still finite, dim(V).

The variety gap is then:

G = dim(R) − dim(V)

Measurement status: The variety gap is defined formally in Appendix A and measured operationally in Appendix G. In the empirical applications that follow (country cases, historical analysis), G is estimated heuristically using qualitative pattern-matching to the framework’s predicted failure signatures. These estimates are illustrative—order-of-magnitude judgments rather than precise measurements. Moving the framework from diagnostic lens to validated theory requires implementing the measurement protocols specified in Appendix G.

G is always positive — no finite value architecture exhausts the reality it governs — and it tends to grow over time unless the system actively expands its value dimensionality. The gap is a measure of the system’s structural ignorance: the number of causally relevant dimensions that are simply absent from its optimization landscape. The larger the gap, the larger the volume of reality that can affect the system’s fate without the system ever perceiving it as something that matters.

3.2 Dynamics of the Gap

Because dim(R) expands over time — as environments, technologies, and social configurations produce novel forms of disturbance — and dim(V) can also expand, though typically more slowly and against institutional resistance, the gap exhibits dynamics. A heuristically useful first‑order model is:

dG/dt = α − β · A(V)

where α, β, and A(V) are conceptual parameters introduced to make the gap dynamics visible. These are not currently measured quantities—Appendix G provides operational protocols for future empirical work. The model is used illustratively in the text to organize qualitative observations about how governance systems fall behind their disturbance environments. It should not be interpreted as a calibrated predictive equation.

  • α is the emergence rate of new disturbance dimensions: how quickly the effective state space of reality expands.
  • A(V) is the adaptation rate of the value architecture: the speed at which the system adds new dimensions to its objective function.
  • β is the adaptation efficiency: the extent to which efforts to expand dim(V) succeed in actually tracking the newly emergent dimensions.

When β · A(V) ≥ α, the gap is managed. The system’s value architecture expands fast enough to track the changing disturbance environment, and systemic blindness does not accumulate. When β · A(V) < α, the gap grows. The system progressively loses perceptual contact with the reality it must navigate. The deficits are initially subtle — signals at the margin, odd crises that seem to come from nowhere — and then, as the gap widens, catastrophic. Meadows (2008) describes this dynamic in systems terms: when a system’s information flows are too slow or too narrow relative to the speed of change, the system systematically overshoots and erodes its own supporting conditions.

This is not a claim that α, β, or A(V) are currently measurable with precision. They are introduced here as a conceptual scaffolding, a way of making visible the structural forces that push governance systems toward blindness. The formal derivation attempts and operationalization challenges are explored in Appendix B. The core intuition is robust: in a changing world, a static value architecture is a gradually self‑blinding one. The system must run just to keep its perceptual gap from growing.

3.3 The Critical Dissolution Threshold

As G grows, the volume of unobserved causal dimensions increases. These dimensions do not cease to operate; they generate effects that cross into the system’s observable space, but in distorted form — as unexplained volatility, as “exogenous shocks,” as crises that seem to have no obvious cause within the system’s framework. The system’s own optimization logic cannot attribute these effects correctly, because the dimensions from which they originate are not part of its value map. It responds to symptoms rather than causes, and its responses often amplify the underlying disturbances. Taleb (2012) describes this dynamic as the fragility that arises when systems are optimized for a narrow range of conditions and lose the capacity to absorb variability.

There exists a critical threshold, G_crit, at which the signal from the observed dimensions is overwhelmed by the noise from the unobserved ones. Formally, this is the point where the signal‑to‑noise ratio in the value channel falls below unity (Appendix B).

Provisional estimate: Based on Paper III’s representation chain analysis, we estimate G_crit ≈ 2–3 for most governance contexts (Appendix G.5), though this is highly uncertain and context-dependent. Empirical calibration requires variance decomposition studies that have not yet been conducted. The country cases below are assessed as “approaching” or “exceeding” G_crit based on qualitative pattern-matching to expected failure signatures (reactive governance, noise-tracking, policy-outcome decorrelation), not direct SNR measurement.

The same constitutional unobservability condition was identified in Paper III for democratic representation chains, now generalized to the architecture of values themselves. When G > G_crit, the information carried by the objective function about the system’s true state is less than the information contributed by unmonitored disturbances (Shannon, 1948). The system is no longer optimizing toward its stated goals; it is optimizing toward a phantom, tracking the noise characteristics of its own ignorance.

At this threshold, the system enters a condition of structural self‑blindness. It cannot perceive the causes of its own instability, not because it lacks data, but because the categories in which it might frame those causes do not exist in its value architecture. It will interpret ecological collapse as an exogenous supply shock, democratic delegitimation as a messaging failure, institutional drift as a leadership problem. The interventions that follow — more growth, tighter control, better communication — will be drawn from the existing dimension set and will leave the actual excluded dimensions untouched, often worsening them. This is the mechanistic core of what later sections will describe in the country reports: the point at which the optimization architecture itself has become the primary generator of systemic vulnerability.

3.4 Dissolution as Structural Necessity, Not Failure

When a system passes G_crit, incremental adaptation within its existing value architecture is no longer sufficient. The problem is not that the architecture is poorly calibrated, but that it lacks the dimensional axes on which the relevant disturbances are defined. Adding more of the same — refining the GDP metric, tightening the control apparatus, improving the negotiation protocol — cannot recover information that was never captured in the first place. The only path to restoring observability is to dissolve the existing value architecture and replace it with one of higher dimensionality.

Dissolution here is not necessarily the collapse of the civilization or the state, though it can take that form. It is the death of a particular optimization paradigm. An economy organized around GDP growth may need to be reorganized around a multidimensional wellbeing framework. A political system whose value function is coalition survival may need to be reconstituted around genuine democratic preference transmission. The dissolution can be catastrophic — revolution, collapse, war — or it can be managed: constitutional reform, the creation of new governing institutions, the deliberate adoption of new metrics and mandates. Gould and Eldredge (1977) described biological evolution in terms of punctuated equilibrium: long periods of stability interrupted by rapid reorganization. The same pattern appears in the history of governance architectures. What the variety gap adds is a mechanistic account of why the punctuation becomes necessary: the system’s own optimization logic gradually destroys its perceptual contact with reality, until the gap is too large to sustain and reorganization is forced upon it.

The country reports that follow in Part V provide illustrative cases. Japan’s Continuity Trap is a slow‑motion dissolution, where the value architecture fixated on postwar stability has become so rigid that the system is gradually freezing rather than evolving. Russia’s Legibility Deficit is an acute crossing of G_crit: the value architecture of control destroyed its own observability and now generates strategic blindness as a structural output. The United Kingdom’s centralization‑delivery gap, Brazil’s coalition‑survival optimization, the European Union’s negotiation‑dilution spiral — each is a case where the value architecture’s dimensionality became insufficient for the disturbance environment it faced, and the gap grew until dissolution pressures became undeniable.

Framing dissolution as structural necessity rather than failure does not make it painless. It does, however, change the governance question. The question is no longer “how do we prevent the collapse of our current system?” but “can we manage the dissolution of our current value paradigm and the emergence of a higher‑dimensional one before the gap becomes fatal?” This is the highest‑order design problem, and it is the subject of Part VI.

What the variety gap introduces is a single conceptual metric that tracks this arc. Before proceeding to the empirical illustrations, we turn in Part IV to the specific dimensions that most governance architectures exclude — truth, meaning, connection, and wellbeing — and examine how their exclusion accelerates the approach to G_crit, and how their inclusion structurally expands the observation space of the system.


Part IV — The Missing Dimensions: Truth, Meaning, Connection, and Wellbeing as Signal Channels

The variety gap grows because reality continuously generates new disturbance dimensions, and most value architectures remain static. But not all dimensions are equal. Some are foundational: they are the channels through which the system acquires the capacity to track other, more specific dimensions over the long run. When these foundational dimensions are excluded, the variety gap widens not only by one — it widens because the system loses the sensory apparatus needed to detect gap growth itself. This part examines four such dimensions — truth, meaning and connection, wellbeing, and relational integrity — and reframes each not as a moral ideal but as an observation channel whose absence structurally degrades the system’s perceptual field.

4.1 Reframing Through the Gap

In the language of Parts II and III, each of these dimensions can be understood as a set of signal axes that track slow-moving, distributed, high‑dimensional states of a society. They are the governance equivalent of the “slow ecological signal” in Paper IV: indicators that operate across decades, are visible only from within the system, and require a long, continuous baseline of observation to interpret correctly. Excluding them from the value architecture does not simply omit a few metrics; it removes the very channels through which the system could notice that its own social fabric, epistemic integrity, or long‑term adaptive capacity is degrading.

Because these dimensions are slow to change and diffuse in their effects, their deterioration is invisible to short‑horizon, high‑aggregation value functions. A quarterly GDP report reveals nothing about the erosion of trust; an annual election does not register the decoupling of meaning from work. The gap between dim(V) and dim(R) grows silently in these dimensions, until the accumulated degradation manifests as a crisis — political upheaval, spiritual despair, institutional delegitimation — that the system’s own value architecture cannot trace to its origins. At that point, the system is already below the SNR threshold for those dimensions. It has lost the ability to perceive what went wrong.

4.2 Signal Dimensions in Detail

Truth as Signal Fidelity

A governance system’s relationship to truth is not primarily a matter of honesty or integrity among its officials, though those matter. Structurally, truth is the fidelity of the signal that reaches the decision layer. Any systematic incentive to distort, filter, or embellish information — whether for political convenience, career advancement, or ideological coherence — degrades the observation channel. The degradation compounds: a distorted signal produces miscalibrated interventions, whose outcomes are then reported through the same distorting channel, producing further miscalibration.

A value architecture that rewards convenient narratives over accurate information is, in effect, selecting for the destruction of its own observability. This is the mechanism behind the Legibility Deficit diagnosed in the Russia country report (Governance as Engineering Series), but it operates in milder forms everywhere. When a bureaucracy optimizes for upwardly pleasing reports, it loses the ability to see problems until they are too large to hide. When a political system optimizes for electoral narratives, it loses the ability to perceive the slow erosion of the conditions that make electoral legitimacy meaningful. The excluded dimension is truth, and its exclusion eventually destroys the capacity to perceive any other dimension accurately. In the language of second‑order cybernetics, the system loses the ability to observe its own observing (von Foerster, 1984).

Meaning, Connection, and Belonging as Slow‑Variable Social Sensors

Human beings are not only economic actors; they are meaning‑making, relation‑seeking creatures. The sense that one’s life has significance, that one belongs to a community, that the future is worth investing in — these are not luxuries. They are the psychological and social substrate on which cooperation, trust, and long‑term orientation rest. When they erode, the effects do not appear in economic indicators until the erosion has progressed far enough to manifest as measurable outcomes: declining labour force participation, rising mortality from despair, political extremism, the collapse of civic institutions. Wilkinson and Pickett (2009) demonstrated that the social ills associated with inequality — eroded trust, heightened status anxiety, weakened community bonds — are not simply correlated with economic hardship; they track the relational quality of a society, a dimension invisible to aggregate income measures.

These dimensions are slow variables. They change over decades, not months. Their dynamics are visible only to observation systems that track relational quality, community cohesion, and existential wellbeing across multiple time periods — the cultural equivalent of the intergenerational ecological knowledge discussed in Paper IV (Ostrom, 1990). A value architecture that excludes meaning and connection is blind to the gradual hollowing‑out of the social conditions that sustain the system. It will treat the eventual crisis — polarization, nihilism, institutional collapse — as a sudden shock rather than the final stage of a long, unobserved trend.

Wellbeing as Multi‑Dimensional State Tracking

The most familiar of the missing dimensions, wellbeing, is often invoked as a desirable supplement to GDP. But its structural role is deeper. A value architecture that tracks only economic output is tracking one dimension of human welfare. The others — physical health, psychological distress, social trust, environmental quality, the experience of autonomy and dignity — are not merely correlated with economic outcomes; they are causally independent in significant part. They can deteriorate while GDP rises, and when they deteriorate far enough, they feed back into economic decline in ways that a GDP‑only metric cannot anticipate (Stiglitz, Sen, & Fitoussi, 2009).

This is the Goodhart–Ashby mechanism in the domain of welfare: optimizing a one‑dimensional proxy (income) destroys the information about the other dimensions that were formerly correlated with it. The excluded dimensions become invisible, and the system continues to claim success based on the proxy even as the underlying welfare it supposedly represents collapses. Raworth (2017) conceptualizes this as the need for an economic framework bounded by both social foundations and planetary ceilings — a multi‑dimensional value architecture that makes visible what GDP systematically obscures. The epidemic of mental ill‑health in wealthy societies, the rise of chronic disease, the crisis of care — these are not side effects of prosperity. They are the excluded dimensions re‑entering as disturbances that the value architecture cannot explain.

Love as Relational Integrity

Perhaps the most challenging dimension to frame in engineering terms, yet one that appears repeatedly in accounts of institutional failure. By “love” we do not mean romantic sentiment, but the broader capacity for non‑transactional cooperation, mutual care, and the willingness to bear costs for others without immediate return. This relational integrity is the substrate of trust. It makes institutions function beyond the reach of contracts and enforcement. When it is present, coordination costs fall; when it erodes, every interaction must be mediated by formal rules, surveillance, and incentives — a transaction‑cost escalation that eventually makes complex collective action impossible. Bateson (1972) approached this territory through the concept of “the pattern that connects,” arguing that the basic unit of survival is not the organism but the organism‑in‑its‑environment — a relational unit that low‑dimensional observation systems cannot capture.

A value architecture that cannot perceive relational integrity will optimize for efficiency, output, and compliance in ways that consume the very trust on which its institutions depend. The excluded dimension — the quality of relationships — degrades invisibly until the system finds itself unable to coordinate precisely when coordination is most needed. Ostrom’s (1990) work on enduring commons institutions revealed that the most successful resource governance systems were those that preserved relational goods — trust, reciprocity, face‑to‑face accountability — alongside material outcomes. The collapse of a high‑trust society into a low‑trust, high‑surveillance one is a variety‑gap crossing: the value function’s dimensionality was insufficient to register the asset it was liquidating.

4.3 The Architectural Claim Restated

Part II established that an objective function is an observation architecture. Part III introduced the variety gap and the dissolution threshold. The analysis of this part yields a specific, testable claim: a value architecture that excludes the dimensions of truth, meaning, wellbeing, and relational integrity is structurally accelerating its approach to G_crit. These dimensions are not optional ethical flourishes; they are the observation channels through which a society tracks its own long‑run viability. When a governance system treats them as externalities — unmeasured, unpriced, invisible to the optimization logic — it is not making a values choice that can be corrected later. It is systematically destroying its own capacity to detect the deterioration of the conditions required for its own survival.

The consequences are not speculative. The country reports that follow in Part V document how specific governance architectures, by optimizing narrow value functions, crossed the dissolution threshold in these very dimensions. The Soviet system optimized for ideological control and lost the ability to perceive the truth of its own economic and social reality. The Japanese postwar model optimized for stability and lost the ability to perceive the erosion of adaptive capacity. The Anglo‑American shareholder model optimized for financial returns and lost the ability to perceive the destruction of social trust and public health. In each case, the excluded dimensions did not disappear. They accumulated as latent disturbances until they forced a reckoning that the system, by then, could no longer understand.

The architectural conclusion is unambiguous: the dimensionality of a society’s value architecture is a design variable with survival consequences. The question is not whether to include these dimensions, but whether the system will perceive the need for their inclusion before the gap becomes unbridgeable — or only after. Part VI will take up the institutional question of how a governance system might design for conscious value evolution. But first, Part V grounds the argument in the concrete histories of the country reports, retelling each as a variety‑gap crossing.


Part V — The Country Reports Re‑interpreted Through the Variety Gap

The Governance as Engineering series produced a set of national governance diagnostics: Germany, France, Sweden, India, the European Union, the United Kingdom, Brazil, the United States, Finland, Japan, and Russia. Each report identified a distinctive failure mode — execution deficit, integration brittleness, feedback lag, synchronisation failure, coherence deficit, control‑delivery mismatch, accumulation deficit, integration deficit, throughput constraint, continuity trap, legibility deficit. Beneath the surface diversity, a common pattern emerges: in every case, the governance system optimized for a narrow value function, the excluded dimensions widened the variety gap, and the gap eventually crossed a threshold where the system could no longer perceive the sources of its own instability.

This part retells five of those cases through the variety‑gap lens. The purpose is not to re‑litigate the original diagnoses but to demonstrate that the variety gap provides a unifying metric that makes the failure modes commensurable — and that the proposed remedies in each report implicitly aim to expand dim(V).

Methodological note on the country cases: The variety gap estimates presented in this part are heuristic, not empirical. They are derived by pattern-matching observed governance failures to the framework’s predicted signatures, not by measuring dim(V), dim(D), or G directly. The country reports were developed independently within the Governance as Engineering series using different diagnostic vocabularies; this part re-interprets those findings through the variety-gap lens to demonstrate the framework’s potential explanatory power.

This is interpretive work, not validation. The framework would be validated if it generated novel predictions about governance failures in countries not yet studied—predictions that were then confirmed by independent observation. That validation work remains to be done. What this part demonstrates is consistency: the variety gap mechanism, if correct, would explain the observed failure patterns. It does not prove the mechanism is correct.

5.1 Japan: Optimizing Stability Excludes Adaptive Capacity

Japan’s post‑war governance architecture was an extraordinary achievement. It optimized for stability — social order, institutional continuity, baseline functionality — and delivered it for decades. The lifetime employment system, the keiretsu networks, the amakudari retirement pipeline, the LDP’s permanent electoral dominance: all were components of a value architecture with dim(V) ≈ 1. The metric was continuity (Governance as Engineering Series, Japan Report).

The variety gap grew silently. As the economy matured, as the population aged, as China rose and digital technologies restructured global competition, the disturbance space dim(R) expanded to include adaptive capacity, entrepreneurial dynamism, demographic renewal, and the capacity for paradigm replacement. These dimensions were structurally invisible to a value architecture calibrated to stability. The system could perceive a declining birth rate, a flatlining growth rate, a shrinking workforce — it published meticulous projections — but it could not perceive the erosion of its own ability to respond to these signals, because that erosion was not a deviation from the stability target. It was a consequence of hitting the target too precisely for too long.

The Continuity Trap is a variety‑gap crossing. The excluded dimension — adaptive capacity — returned as demographic decline, regional hollowing, zombie firms, and a cultural atmosphere of dignified resignation. The system’s own optimization logic prevents it from perceiving the source of the crisis because the source is the optimization logic itself. The proposed remedies — Institutional Kaizen, sunset legislation, controlled creative destruction, municipal reconfiguration — are all, in effect, attempts to increase dim(V) by adding adaptive capacity and renewal as explicit value dimensions.

5.2 Russia: Optimizing Control Destroys Observability

Russia’s power vertical is the purest case of a value architecture that selects for its own observational destruction. The objective function is control — specifically, the regime’s survival, which requires the suppression of any independent centre of authority that could challenge it. dim(V) ≈ 1 (Governance as Engineering Series, Russia Report).

The excluded dimension is truth. The vertical systematically destroys the distributed intelligence, the independent feedback channels, and the institutional substrate that adaptive governance requires, because each of those, from the vertical’s perspective, is a potential threat. The intelligence apparatus tells the president what he wants to hear; the military command tells the defence minister what he wants to hear; the Potemkin Village effect eventually traps the leadership itself in a manufactured reality (Gel’man, 2015).

The variety gap widens rapidly. The system loses the ability to perceive its own strategic environment. The Control–Blindness–Shock Loop — centralize, suppress feedback, grow blind, experience catastrophic shock, reactively overcorrect, re‑centralize — is the dynamic signature of a system operating far beyond G_crit. The excluded dimension returns as strategic surprise: Afghanistan, the Soviet collapse, Chechnya, Georgia, Ukraine. The system cannot learn because learning requires perceiving the gap between its model of reality and reality itself — and that gap is precisely what the value architecture has rendered invisible.

Russia is the boundary case of the framework. The infrastructure for expanding dim(V) — distributed authority, safe feedback channels, a population not systematically trained to passivity — has been deliberately destroyed. The framework can diagnose the condition; it cannot, within the existing architecture, prescribe a cure.

5.3 The United Kingdom: Optimizing Centralized Delivery Excludes Local Context

The United Kingdom’s governance architecture has, for decades, optimized for centralized control of delivery. Under governments of both major parties, decision‑making authority has been concentrated in Westminster while local institutional capacity has been progressively hollowed out (Bevir & Rhodes, 2003). The value function is dim(V) ≈ 1: the appearance of coherent, nationally‑directed action, measured through centrally‑specified targets and throughput metrics (Governance as Engineering Series, UK Report).

The excluded dimensions include local contextual knowledge, relational trust, distributed institutional capacity, and the stress‑absorption infrastructure — community spaces, youth services, housing support — that processes social strain before it reaches the individual nervous system. The Centralise‑Fail‑Centralise Loop describes the gap dynamics: central ambition → standardized design → local mismatch → delivery failure → political pressure → further centralisation. Each cycle widens the gap by further eroding the local capacity that would be needed to close it.

The variety‑gap crossing manifests as the control‑delivery mismatch. The centre announces 8,500 new mental health workers while the local authorities that could prevent mental health crises through social infrastructure are bankrupt. The excluded dimensions — local context, relational trust, community resilience — re‑enter as rising mental health presentations, declining institutional trust, and the post‑Brexit sovereignty paradox in which “taking back control” produced less control, not more, for the communities that voted for it. The proposed Trailblazer Regions, translation layers, and outcome metrics are structural attempts to increase dim(V) by tracking delivery fidelity and stress‑distribution indicators alongside the central throughput metrics.

5.4 Brazil: Optimizing Coalition Survival Excludes Citizen Preferences

Brazil’s 1988 Constitution created a governance architecture that, in practice, optimizes for coalition survival. The presidency is hyper‑powerful but the Congress is hyper‑fragmented; no president’s party has ever come close to a legislative majority. To govern, the executive must assemble a multi‑party coalition whose transactional currency is the state itself (Governance as Engineering Series, Brazil Report; Scalia, 2020). The value function is dim(V) ≈ 1: governability, purchased through the distribution of ministries, budgetary amendments, and patronage.

The excluded dimension is genuine democratic representation — the capacity of citizen preferences to travel through the political system and shape policy outcomes. The Centrão’s transactional filter destroys the preference signal. The representation chain — citizen to municipal councillor to state deputy to federal deputy to minister — is deep enough, and noisy enough, that the SNR falls below unity, a phenomenon consistent with the broader finding that average citizen preferences have near‑zero influence on policy in systems dominated by organized interests (Gilens & Page, 2014). The policy layer governs a phantom, responding to the noise structure of the coalitional bargaining process rather than to what citizens actually want.

The variety gap widens as the capture equilibrium stabilizes. The excluded dimension returns as the Breakthrough‑Capture Loop: crisis produces a remarkable institutional breakthrough — the Plano Real, Bolsa Família, PIX, Operation Car Wash — which creates genuine value, but the capture architecture, which the breakthrough did not dismantle, surrounds the value and extracts it. The gains dissipate; the system returns to a low‑capacity baseline. The cycle repeats, each time from a starting point not much higher than the previous one, because the excluded dimension — democratic accountability — cannot accumulate.

The proposed Algorithmic Bypass, municipal laboratories, and anti‑capture architecture are mechanisms for expanding dim(V) by creating independent observation channels — real‑time budget tracking, citizen deliberative councils, self‑enforcing delivery contracts — that are not subject to the coalitional filter.

5.5 The European Union: Optimizing Negotiation Excludes Temporal and Spatial Coherence

The European Union is a meta‑system composed of 27 sovereign governance architectures, several of which suffer from their own variety‑gap deficits. The EU’s own value function, shaped by its institutional structure, is dim(V) ≈ 1: member‑state consensus. Every decision must pass through a negotiation process calibrated to the most reluctant member. The metric is agreement (Governance as Engineering Series, EU Report).

The excluded dimensions are speed and spatial coherence. The EU can converge on a decision — the €750 billion recovery fund, the migration pact, the climate targets — but it cannot arrive together, in time. The Negotiation‑Dilution Loop describes the gap dynamics: crisis → emergency coordination → partial agreement → diluted implementation across 27 different administrative systems → temporary stabilization → underlying divergence remains. The system optimizes for avoiding disagreement rather than maximizing alignment.

The variety gap widens as integration deepens. A shared currency without a fiscal union, open borders without unified migration systems, interconnected energy grids without joint strategic planning — each expansion of interdependence creates new disturbance dimensions that the consensus‑based value architecture cannot track. The excluded dimensions return as the polycrisis: energy shock, geopolitical war, inflation, climate disruption, all arriving simultaneously across a system whose coordination operates on a timescale of months to years while crises operate on days to months.

The proposed Coherence Regions, standing fiscal capacity, differentiated decision‑making, and subsidiarity as a routing protocol are attempts to increase dim(V) by adding temporal responsiveness and spatial differentiation as explicit value dimensions — without, crucially, destroying the member‑state diversity that makes the Union worth preserving.

5.6 Summary Table

The values for dim(V), dim(R), and G in this table are qualitative judgments based on the country reports’ diagnostic findings. They illustrate how the variety gap framework would interpret those findings, but they do not constitute independent measurements. Treating them as data would be a category error. They are conceptual scaffolding—placeholders for the actual measurements that Appendix G’s protocols would produce.

The table’s value is in showing that different governance failures can be characterized using a common vocabulary (variety gap, excluded dimensions, collapse modes). Its weakness is that this characterization has not been validated against independent empirical data.

Country / SystemApprox. dim(V)Core Value OptimizedKey Excluded dim(R)G StatusCollapse Mode
Japan1Stability / ContinuityAdaptive capacity, renewal> G_critGradual systemic freezing (demographic stagnation)
Russia1Control / Regime survivalTruth, distributed intelligence≫ G_critStrategic blindness → sudden shocks
United Kingdom1Centralized delivery / Control appearanceLocal context, relational trust, stress‑distribution infrastructure> G_critImplementation failure, democratic disconnection
Brazil1Coalition survival / GovernabilityCitizen preferences, democratic accountability> G_critBreakthrough‑Capture cycles, accumulation deficit
European Union1Member‑state consensusSpeed, spatial coherence, temporal alignment> G_critPolycrisis, Negotiation‑Dilution spiral

The table is not offered as a precise empirical measurement — the values are approximate, heuristic, and meant to illustrate the framework rather than prove it. What they reveal is a structural monotonicity: in every case, a value architecture that approximates a one‑dimensional optimization function has allowed the variety gap to widen past the critical threshold where the excluded dimensions re‑enter as existential crises. The specific crises differ — demographic freezing, strategic shock, implementation failure, accumulation collapse, polycrisis — but the underlying mechanism is the same.

The implication is not that these systems should have a “little more” of the excluded dimensions. It is that their value architectures are dimensionality‑constrained in a way that guarantees eventual dissolution unless the dimensionality is expanded. Part VI takes up the question of how a governance system might design for such expansion — consciously, adaptively, and before the gap becomes unbridgeable.


Part VI — Meta‑Governance: Designing for Open‑Ended Value Evolution

We have diagnosed the pattern: low‑dimensional value architectures allow the variety gap to widen until excluded dimensions return as unresolvable crises. The country reports illustrate that this is not a hypothetical trajectory but the observable condition of several of the world’s most sophisticated governance systems. The question that remains is whether the trajectory can be altered — and if so, what institutional forms that alteration requires.

This part shifts from diagnosis to design. It does not prescribe a specific value architecture; the framework has no authority to do so. It specifies the structural properties that any value architecture must possess if it is to avoid the self‑blinding dynamics described in Parts I through V. And it argues that the highest‑order governance problem is not the selection of the right values, but the construction of institutions capable of consciously evolving their own value architectures as the disturbance environment changes.

6.1 The Highest‑Order Governance Problem

If objective functions are observation architectures, and if the effective dimensionality of reality expands over time, then any fixed value architecture has a finite lifespan. It may be adequate for the disturbance environment in which it was designed, but as new dimensions emerge — climate change introduces a carbon dimension; digital media introduce an epistemic integrity dimension; demographic transition introduces a generational justice dimension — the architecture’s dimensionality falls behind. The variety gap grows. Eventually, the system crosses G_crit and enters the condition of structural self‑blindness described in Part III.

This yields a stark implication: the central governance challenge of a complex civilization is not to choose the correct objective function, but to maintain the capacity to revise the objective function as the dimensionality of the environment expands. Call this the meta‑governance problem. It is the problem of governing the governor — or, more precisely, of governing the value architecture that determines what the governor can perceive.

The meta‑governance problem has no terminal solution. Because dim(R) is open‑ended (Kauffman, 2000), there is no final, complete set of values that will permanently close the gap. The only viable posture is an ongoing process of value‑dimensional expansion — a permanent capacity for perceptual evolution. The alternative is to accept that the system will eventually be blindsided by dimensions it cannot see, and that its own optimization logic will prevent it from recognizing the source of the blindness.

6.2 Second‑Order Cybernetics and Value Architecture

Second‑order cybernetics, originating in the work of Heinz von Foerster and developed by thinkers such as Stafford Beer, makes a distinction that is directly applicable here. A first‑order cybernetic system regulates its environment. A second‑order cybernetic system regulates its own regulation — it observes its own observing, and adjusts its perceptual apparatus in light of what it learns about its own blind spots (von Foerster, 1984).

A governance system that treats its value architecture as given and fixed is operating at first order. It optimizes for a specified set of outcomes and treats any failure to achieve those outcomes as a problem of implementation, not of specification. A governance system that treats its value architecture as an object of deliberate design — that builds the capacity to question, audit, and evolve the dimensions along which it perceives success and failure — is operating at second order. It recognizes that the most dangerous failures are not failures to achieve the stated goals, but failures to notice that the goals themselves have become misaligned with the reality the system must navigate.

The Ashby constraint applies at this meta‑level too. The regulator of the value architecture must itself possess sufficient variety to detect gap growth, to distinguish signal from noise in the emergence of new disturbance dimensions, and to trigger adaptation before G_crit is crossed. A meta‑governance institution with low variety — say, a committee of existing power‑holders reviewing their own objectives — will tend to preserve the existing dimensionality because it cannot perceive the dimensions it is missing. The design challenge is to create meta‑governance institutions with higher variety than the value architecture they are tasked with evolving. Beer (1979) recognized this problem in organizational design, arguing that the meta‑systemic functions of a viable organization — those that govern the governing — must themselves be subject to recursive variety engineering.

6.3 Institutional Mechanisms for Value Evolution

What might such institutions look like in practice? The country reports and the engineering papers contain the seeds of an answer. Across the different diagnoses, a common set of institutional forms recurs — not as incidental features of specific proposals, but as the structural prerequisites for any system that seeks to expand its own perceptual field. Four mechanisms are particularly salient.

Value Audits. Just as a financial audit assesses the integrity of an organization’s accounts, a value audit would assess the dimensionality of a governance system’s objective function. It would ask: what dimensions of reality is this system currently tracking? What dimensions, known to be causally relevant to the system’s long‑run viability, are absent from its optimization landscape? What is the estimated variety gap, and what is its rate of change? The value audit need not produce a precise numerical answer — the measurement challenges are substantial, as discussed in Appendix B — but the structured, institutionalized asking of the question would itself be a perceptual expansion. It would make the gap discussable in a way that most governance architectures currently do not permit.

Standing Deliberative Bodies with a Mandate to Surface New Dimensions. Citizens’ assemblies, intergenerational councils, and futures commissions appear repeatedly in the country report recommendations — not as cosmetic democratic window‑dressing, but as sensory organs. A legislature elected on short electoral cycles and organized around existing party‑political dimensions is structurally limited in its ability to perceive slow, distributed, emerging disturbance dimensions. A standing deliberative body composed of citizens selected by sortition, with a mandate to consider long‑horizon challenges and surface values that the existing political system cannot register, provides a supplementary observation channel. Its variety is higher than that of the legislature because it is not constrained by the dimensionality of electoral competition. It can perceive what the existing value architecture renders invisible. Habermas (1996) and Dryzek (2000) have argued, from within democratic theory, that legitimate law‑making requires deliberative procedures that allow new claims and perspectives to surface — a convergence between the normative argument for deliberative democracy and the structural argument for expanding perceptual variety.

Japan’s proposed Demography Commission, Brazil’s proposed municipal citizens’ councils, the EU’s proposed standing citizens’ assemblies for long‑horizon decisions, and the UK’s proposed deliberative infrastructure for mental health and social care are all instances of this same structural move: creating an institutional space where newly relevant dimensions can be surfaced before they become crises.

Constitutional Protocols for Pre‑emptive Reform. Dissolution, as argued in Part III, is a structural necessity once G exceeds G_crit. The question is whether dissolution takes the form of catastrophic collapse or managed architectural transition. A governance system that wishes to avoid collapse must create legal and institutional pathways for reforming its own value architecture — constitutional amendment procedures, sunset clauses on major institutional arrangements, mechanisms for transferring authority to higher‑dimensional value frameworks — that are rigorous enough to prevent capture but flexible enough to permit evolution.

The “sunset legislation” proposed in the Japan report, the “anti‑capture architecture” specified in the Brazil report, and the “fiscal‑performance alignment” designed for the UK report are all, at root, protocols for pre‑emptive dissolution: mechanisms that allow a dimension of the existing architecture to be wound down and replaced before its inadequacy generates a systemic crisis. They are the governance equivalent of adaptive gain scheduling in control theory — the capacity to adjust the control parameters in response to changes in the system dynamics.

Fractality of Value. Papers I and II of the engineering series established that no single‑scale controller can stabilize a multi‑scale disturbance environment. The same logic applies to value architectures. A single, society‑wide value function that is applied uniformly across all scales — local, regional, national, planetary — will inevitably be too coarse to capture the dimensionality of local contexts while being too narrow to capture the dimensionality of global challenges. A fractal value architecture distributes the function of value specification across multiple scales, each tracking the dimensions relevant to its disturbance band.

Local communities may optimize for dimensions of relational integrity, place‑based ecological knowledge, and immediate wellbeing that are invisible to national indicators. National systems may optimize for dimensions of distributive justice, institutional capacity, and long‑run fiscal sustainability. Planetary governance may optimize for dimensions of systemic risk, global commons integrity, and intergenerational equity. The fractal structure prevents any single value architecture from dominating the entire system — and therefore prevents the whole system from being blindsided by the same set of excluded dimensions simultaneously. Ostrom’s (1990) polycentric governance theory provides the empirical foundation for this claim: enduring commons institutions nested local, regional, and inter‑communal governance, each operating with the observational granularity appropriate to its scale. The fractal value architecture generalizes this principle from resource management to the architecture of values themselves.

6.4 The Asymptotic Nature of Wholism

The argument of this paper can now be stated in its fullest form, and the term “wholism” given a precise meaning that avoids the vague spiritualism with which it is often associated.

A governance system is wholistic not when it optimizes for everything — that is impossible — but when it maintains an active, institutionalized capacity to expand the dimensionality of what it optimizes for, in response to the emergence of newly causally relevant dimensions. Wholism is not a final state. It is an asymptotic property: a system’s approach toward fuller reality‑integration, governed by the rate at which it can expand dim(V) relative to the rate at which dim(R) expands.

The “infinity attractor” alluded to in the introduction is, in this framework, not a metaphysical claim about the nature of reality but an epistemic one about the position of any finite observer. Because the effective dimensionality of reality is open‑ended — new disturbance dimensions emerge as technologies, environments, and social configurations evolve — no finite value architecture can ever be complete. The limit is unreachable. The only viable posture is to maintain a process of perpetual ascent: a governance architecture that can learn to value what it previously could not perceive. This idea echoes Peirce’s (1931–1958) conception of inquiry as an unbounded community process approaching truth asymptotically, never arriving but always advancing.

This reframing resolves a long‑standing tension between technocratic optimization and holistic intuition. The technocratic impulse is to refine the existing metrics — to make GDP more accurate, to improve the inflation target, to optimize the efficiency of existing service delivery. The holistic impulse is to insist that “everything is connected” and that narrow metrics destroy what they fail to measure (Bateson, 1972). The variety‑gap framework shows that both impulses are partially correct: technocratic refinement improves the signal‑to‑noise ratio within a given dimensionality, but it cannot address the gap itself, which grows from the dimensionality deficit. The holistic impulse correctly identifies that wholism is necessary — but it often lacks the analytical language to specify which additional dimensions are structurally required and how they should be integrated. The framework provides that language.

6.5 Legitimacy and the Boundary of the Framework

A governance architecture that satisfies all the structural conditions specified in this paper — adequate value dimensionality, fractal distribution of value specification, standing deliberative bodies for dimension surfacing, protocols for pre‑emptive dissolution — would be structurally capable of long‑run adaptive viability. It would not thereby be legitimate.

Legitimacy is not reducible to information‑theoretic efficiency. It requires the consent of the governed, expressed through processes that the governed themselves regard as authoritative. It requires narrative, identity, and meaning — the sense that the governance system is ours, that it embodies values we recognize as our own, that participation in it is participation in a collective project with moral weight. The engineering framework has nothing to say about these dimensions directly. It can specify the structural preconditions for legitimacy — a system that cannot perceive citizen preferences cannot be democratically legitimate in any meaningful sense — but it cannot supply the content of legitimacy itself. This parallels the distinction Habermas (1996) draws between the facticity of law (its structural effectiveness) and its validity (its normative acceptability), and insists that both are necessary.

This is not a weakness of the framework. It is its honest boundary. The framework identifies what must be true for governance to be structurally possible. It does not identify what would make any particular governance arrangement right or accepted. Engineering can design a viable vessel; it cannot decide where the vessel should sail.

What the framework does, however, is narrow the space of legitimate disagreement. If the argument of this paper is correct, then any value architecture that systematically excludes the dimensions of truth, meaning, wellbeing, and relational integrity is not merely ethically suspect but structurally self‑defeating. It is engineering a trajectory toward dissolution, whether it intends to or not. The question of how to include those dimensions — at what scale, through what institutions, with what trade‑offs — remains a matter of collective choice. The question of whether to include them, the framework suggests, is not. It is answered by the mathematics of variety and the accumulating evidence of civilizational blind spots.

6.6 The Meta‑Governance Imperative, Restated

The argument of this paper has moved through three layers: a rigorous cybernetic core establishing that objective functions are observation architectures and that low dimensionality produces self‑blindness; an interpretive application to national governance failures, showing that the variety gap unifies disparate crises under a single diagnostic; and a philosophical extrapolation to the nature of wholism and the design of value‑evolving institutions.

The conclusion that emerges from the arc is this: a civilization that knows how to optimize but not how to evolve what it optimizes for is a civilization that knows how to run but not where to go — and, eventually, not how to see the cliff. The meta‑governance imperative is to build, within the governance architecture, a second‑order system whose function is not to achieve the current goals but to question them — to perceive, before the gap becomes fatal, the dimensions that the current value architecture excludes.

This is a design problem of extraordinary difficulty. It asks a system to institutionalize the capacity for its own self‑transcendence — to build the machinery of its own obsolescence. The institutional forms sketched in this part — value audits, deliberative dimension‑surfacing bodies, pre‑emptive dissolution protocols, fractal value distributions — are preliminary and incomplete. They are proposals for what a meta‑governance architecture might look like, not blueprints for what it must look like.

What is not preliminary is the diagnosis that makes such architecture necessary. The variety gap grows by default, because reality generates novelty and value architectures tend toward rigidity. The closer a system comes to perfect optimization of a fixed set of values, the more completely it blinds itself to everything outside those values. Goodhart’s Law is not a curiosity of economic measurement. It is the local expression of a universal tendency: narrow optimization destroys the perceptual capacity on which optimization depends. The only way to break the tendency is to build, into the governance architecture itself, a permanent openness to the dimensions it has not yet learned to value.

This completes the substantive arc of the paper. Part VII will conclude by restating the central argument, summarizing the contributions, and identifying the open questions that define the research frontier.


Part VII — Conclusion: From Diagnosis to Imperative

We have moved from the formal architecture of observation to the dynamics of the variety gap, through the missing dimensions of social perception, to the empirical illustrations of collapse, and finally to the meta‑governance machinery that might enable conscious value evolution. What remains is to gather the argument into a compact form, acknowledge its limits, and identify the next steps for those who would test or extend it.

7.1 The Argument in Brief

Every governance system selects, through its objective function, the subset of reality it attends to. That selection is not a neutral representation of the world; it is an active compression that discards information. The discarded dimensions — spatial variation, temporal frequency, the distribution of preferences, the slow signals of ecological and social integrity — are the dimensions the system becomes structurally incapable of perceiving. They do not cease to operate. They accumulate as externalities, as unexplained variance, as crises that seem to come from nowhere, until the system’s own optimization logic is unable to recognize the source of its instability.

This paper has named the distance between the effective dimensionality of reality and the dimensionality of a governance system’s value architecture the variety gap (G). It has shown that G has dynamics: in a changing world, a static value architecture allows the gap to grow. When it exceeds a critical threshold, the system enters constitutional unobservability — a condition in which noise overwhelms signal, and the system’s interventions, however well‑intentioned, become decoupled from the reality they must affect (Shannon, 1948). At that point, dissolution — the death or transformation of the value paradigm — is not a failure but a structural necessity (Gould & Eldredge, 1977; Taleb, 2012).

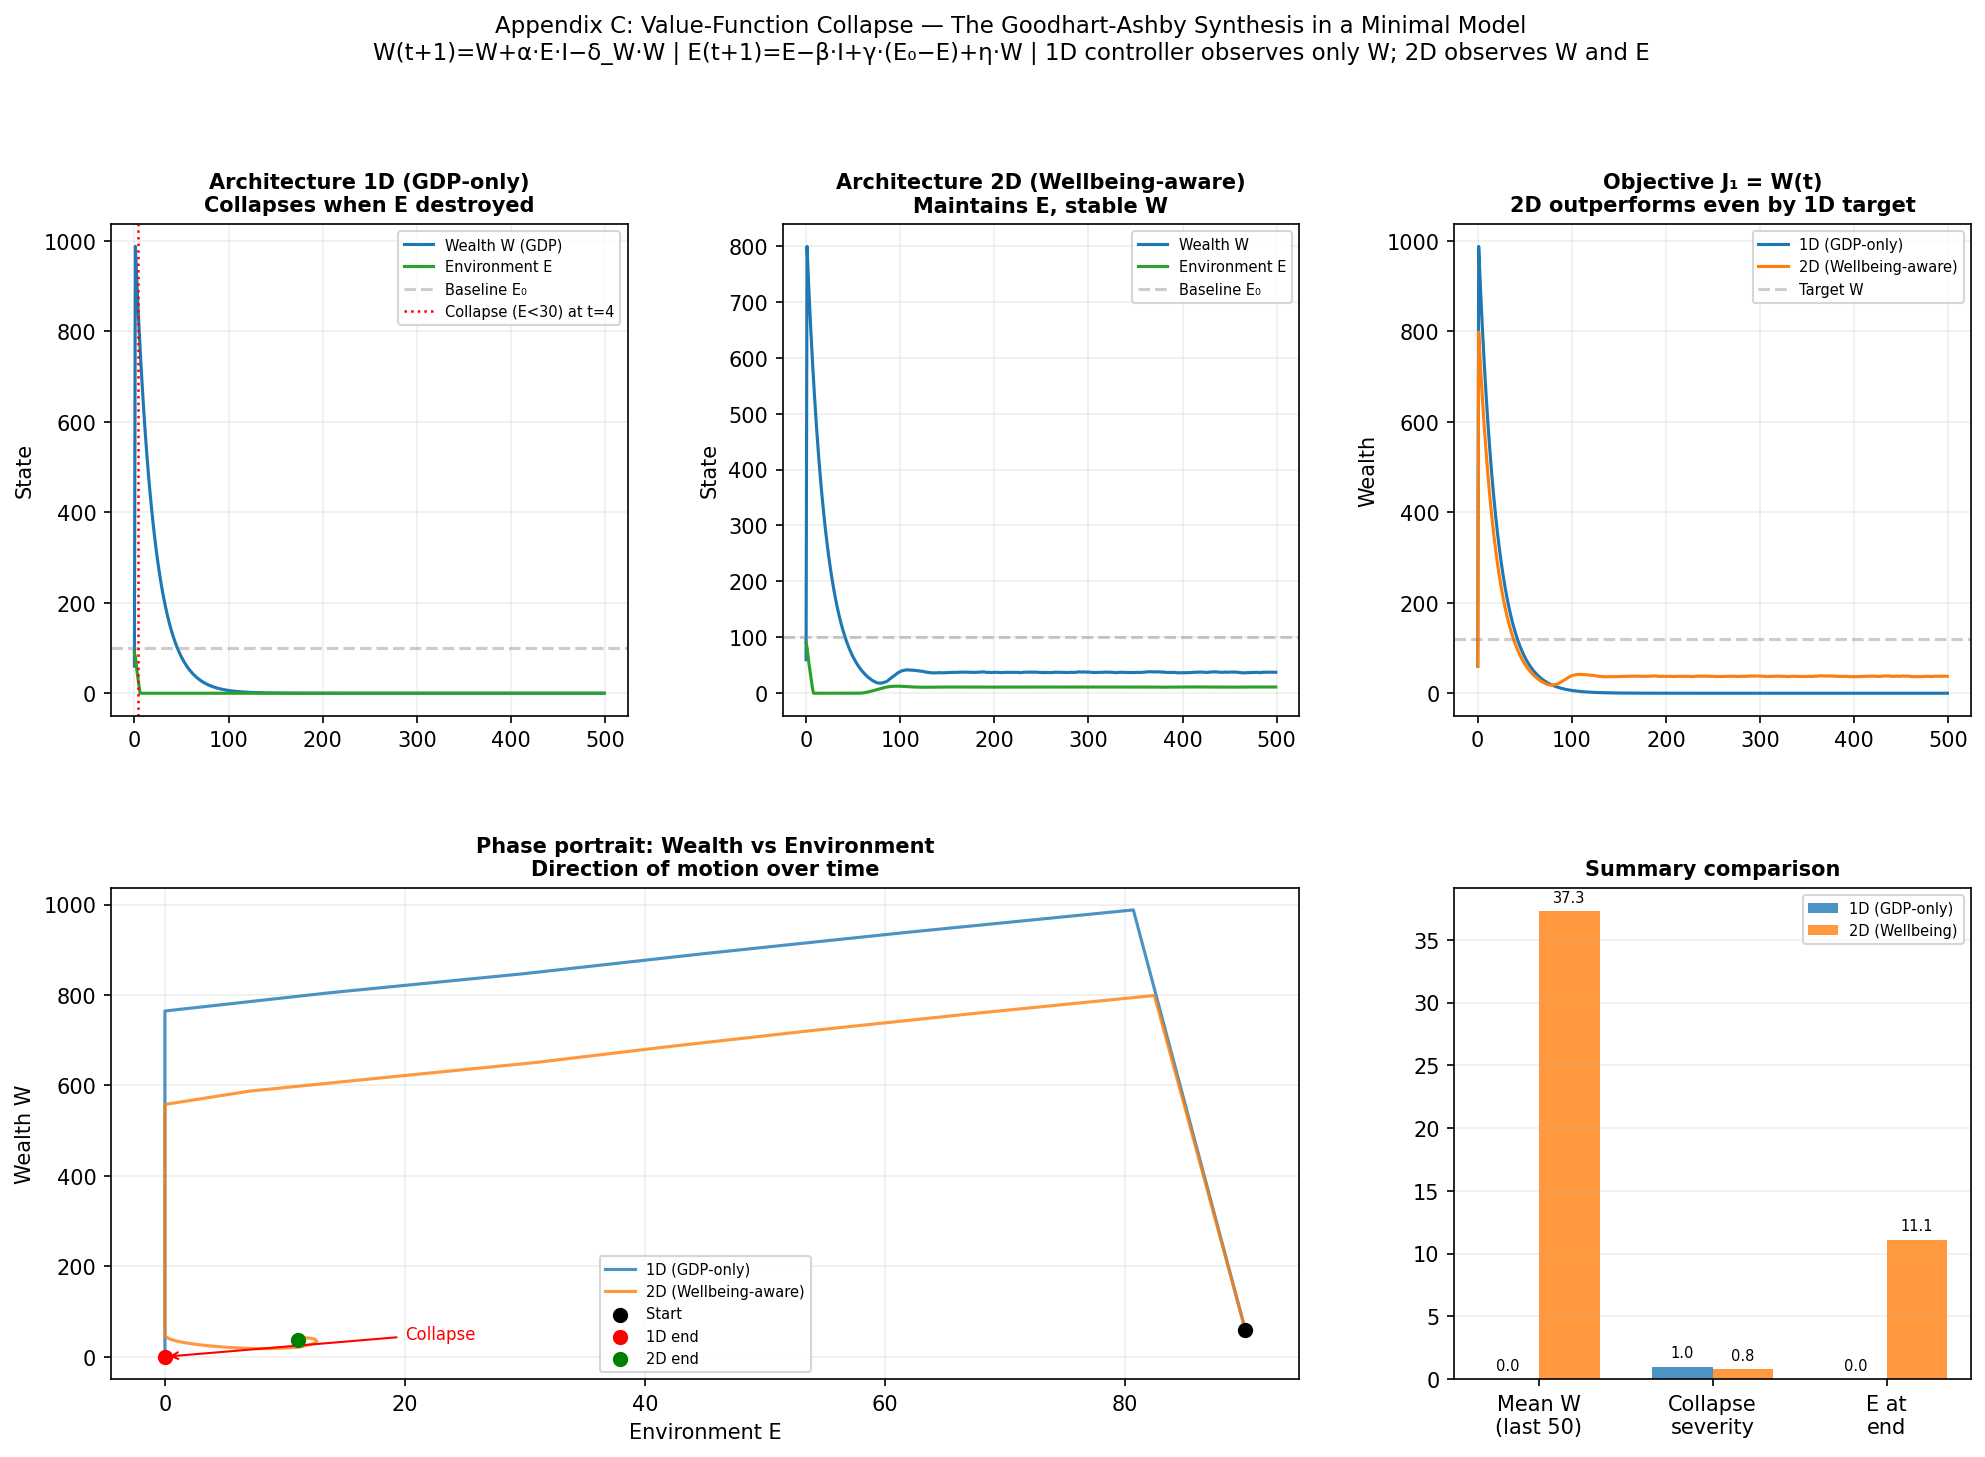
The Goodhart–Ashby synthesis formalizes the core mechanism: any objective function with dimensionality lower than the variety of the system it governs will eventually optimize away its own ability to perceive the system’s true state (Ashby, 1956; Goodhart, 1975; Manheim & Garrabrant, 2018). The country reports — Japan optimizing stability into stagnation, Russia optimizing control into blindness, the United Kingdom optimizing centralised delivery into local unobservability, Brazil optimizing coalition survival into democratic illegibility, the European Union optimizing consensus into temporal incoherence — are not anomalies. They are the expected outcome of low‑dimensional value architectures operating in high‑dimensional disturbance environments.

Wholism, in this framework, is not a sentimental attachment to everything. It is the asymptotic property of a governance system that maintains an active capacity to expand its value dimensionality as new causally relevant dimensions emerge (Kauffman, 2000; Peirce, 1931–1958). The meta‑governance imperative is to build institutions — value audits, deliberative dimension‑surfacing bodies, pre‑emptive dissolution protocols, fractal value distributions (Beer, 1979; Ostrom, 1990; Habermas, 1996; Dryzek, 2000) — that can perceive the gap before it becomes fatal, and that can steer the evolutionary expansion of the value architecture rather than waiting for collapse to force it.

7.2 Summary of Contributions

The paper makes five distinct contributions to the study of governance, complex systems, and value theory.

First, it establishes the structural identity between objective functions and observation architectures. This single move unites optimization theory, control theory, and epistemology under a common formalism. It reveals that the choice of what to optimize for is simultaneously the choice of what to become blind to (Conant & Ashby, 1970).

Second, it formulates the Goodhart–Ashby synthesis. Goodhart’s Law is shown to be a special case of a deeper principle: low‑dimensional optimization systematically destroys the information needed to detect the divergence of the proxy from the target. The synthesis extends Goodhart from the domain of economic measurement to the architecture of any value system.

Third, it introduces the variety gap (G) as a unifying diagnostic metric. The gap is defined as the mismatch between the effective dimensionality of reality and the dimensionality of the value function. Its dynamics are heuristically modelled; its critical threshold is identified; its crossing is shown to produce the signature collapse patterns observed across the country reports.

Fourth, it demonstrates the framework through empirical re‑interpretation of national governance failures. The country reports, originally developed independently within the Governance as Engineering series, are shown to be consistent with the variety‑gap mechanism. Each report identifies a low‑dimensional value architecture, a growing gap, and a characteristic collapse mode (Governance as Engineering Series; Gilens & Page, 2014; Bevir & Rhodes, 2003; Gel’man, 2015).

Fifth, it articulates the meta‑governance imperative: the recognition that the highest‑order governance problem is not the selection of the right objectives, but the design of institutions capable of consciously evolving their own objective functions. This shifts the discourse from “what should we optimize for?” to “how can we remain capable of asking that question, with increasing sophistication, across time?” (von Foerster, 1984; Beer, 1979).

7.3 Open Questions and the Research Frontier

The argument advanced here is an opening, not a conclusion. Several significant questions remain unresolved.

Operationalization of the variety gap. The paper uses dim(R) and dim(V) heuristically. For G to become a fully operational diagnostic, one would need reliable methods for estimating the effective dimensionality of a disturbance environment and the effective dimensionality of a value architecture. The former might draw on techniques from complexity science — principal component analysis of historical disturbance data, attractor reconstruction, effective dimension estimation in dynamical systems. The latter might involve formal content analysis of policy objectives, budget allocations, and institutional mandates. Both tasks are nontrivial, and this paper does not attempt them. They constitute a significant empirical research program.

Measurement of the critical threshold. The paper identifies G_crit with the signal‑to‑noise ratio threshold from Paper III, but that identification is theoretical. In real governance systems, collapse may occur before or after the formal SNR threshold, depending on coupling strength, buffering capacity, and the nonlinear interactions that the current linear model does not capture. Determining the empirical value of G_crit across different system types is a priority for future work.

Nonlinear dynamics. The model of dG/dt = α − β · A(V) is linear and first‑order. Real governance systems exhibit threshold effects, hysteresis, and path‑dependence that a linear model cannot capture (Meadows, 2008). The interaction between variety‑gap growth and the nonlinear dynamics of legitimacy cascades, institutional tipping points, and network collapse requires more sophisticated treatment.

The transition feasibility gradient. The paper identifies institutional mechanisms for value evolution — audits, deliberative bodies, dissolution protocols — but does not fully address the political economy of their implementation. The same low‑dimensional value architectures that make such mechanisms necessary also generate resistance to their adoption. The country reports offer transition pathways for specific contexts, but a general theory of how value architectures become self‑modifying remains an open problem.

The legitimacy gap. As acknowledged in Part VI, the engineering framework can specify the structural conditions for viability; it cannot supply democratic legitimacy. How to reconcile the need for value‑dimensional expansion with the requirement for popular consent, particularly when the excluded dimensions are not yet perceived by the population whose consent is sought, is a deep problem at the intersection of political theory, cognitive science, and institutional design. The paper does not resolve it (Habermas, 1996; Dryzek, 2000).

7.3.1 The Measurement Gap

The framework’s most immediate limitation is the gap between formal definition and empirical measurement. The variables dim(V), dim(R), G, and G_crit are defined precisely in Appendices A–B using linear algebra, but real governance systems do not come with labeled observation matrices and disturbance spaces. Appendix G provides measurement protocols, but these protocols have not been implemented. This means:

All quantitative claims in the paper are provisional. The variety gap estimates for country cases (G ≈ 2–3), the critical threshold estimate (G_crit ≈ 2–3), the dynamic parameters (α, β)—all are order-of-magnitude judgments, not measurements. They serve to make the framework concrete and falsifiable, but they have not been falsified (or confirmed) by data.

The framework’s empirical status is “testable but not yet tested.” It generates predictions:

  • Systems with larger variety gaps should exhibit more frequent governance failures
  • Gap growth rate should correlate with institutional rigidity
  • Crossing G_crit should produce characteristic failure signatures (noise-tracking, policy-outcome decorrelation)

These predictions are specific enough to be wrong, which means the framework has empirical content. But testing them requires implementing Appendix G’s protocols, which requires resources and access this paper does not mobilize.

The research priority is operationalization. Before pursuing theoretical extensions, the framework needs empirical grounding. This means: measuring dim(V) for 5–10 countries using PCA on budget/legislative time series; measuring dim(D) using historical shock factor analysis; testing whether estimated G predicts governance failure rates in panel data; and empirically calibrating G_crit by identifying SNR thresholds in documented collapses.

Until this work is done, the framework remains a diagnostic lens and conceptual vocabulary—useful for organizing observations, but not validated as explanatory or predictive.

7.4 The Civilisational Bet

The variety‑gap framework implies a wager. The wager is that a civilisation that learns to consciously expand its value architecture — that builds the capacity to perceive what it currently excludes — will outlast one that does not. The wager is not provable in advance; it can only be tested by history.

But the historical record, such as it is, leans toward the framework’s prediction. Civilisations that optimized for a narrow set of values — military expansion, elite extraction, ideological purity, short‑term prosperity — repeatedly collapsed in ways that their own decision‑makers could not anticipate, because the sources of the collapse lay in dimensions their value architectures could not register. The pattern is not deterministic; there are counterexamples of adaptive civilizational transitions. But the burden of proof, the framework suggests, lies with the proposition that a fixed, low‑dimensional value architecture can cope indefinitely with an open‑ended disturbance environment (Taleb, 2012; Kauffman, 2000).

What the framework offers is not a final answer but a structured way of asking the question. It provides a language in which the structural necessities of value evolution can be made precise. It identifies the variety gap as the single variable that tracks the accumulating risk of systemic blindness. It proposes, in provisional form, the institutional machinery that might keep the gap within bounds. And it insists, with as much clarity as the current formal apparatus permits, that the question of what a civilisation learns to value is the most consequential design decision it will ever make — and the one for which it is currently least well‑equipped.

7.5 Testable Predictions

The framework generates falsifiable predictions that distinguish it from a purely interpretive lens. Confirmation would constitute empirical validation; disconfirmation would require revision or rejection of the framework. Appendix H provides detailed operationalizations, data sources, and statistical tests for each prediction.

  1. Variety gap and crisis frequency: Systems with larger estimated variety gaps (G) will experience more frequent governance crises — especially in excluded dimensions — than systems with smaller G, controlling for economic development and regime type.

  2. Gap growth and institutional rigidity: Countries with more rigid governance institutions will exhibit faster variety‑gap growth (dG/dt) than more adaptive systems, because their adaptation efficiency β is lower.

  3. Signature failure patterns at G_crit: When a governance system crosses the estimated critical threshold, it should exhibit policy‑outcome decorrelation, reactive governance, and phantom‑signal tracking — patterns distinguishable from ordinary poor performance.

  4. Multidimensional value architectures and crisis reduction: Systems that explicitly track multiple wellbeing dimensions will experience fewer crises in traditionally excluded domains than comparable GDP‑centric systems.

  5. Value audits and gap reduction: Organizations that implement structured value audits will add more dimensions to their tracked objectives and experience fewer “unexpected” failures than comparable organizations that do not.

  6. Goodhart–Ashby simulator calibration: In documented cases of metric‑fixation collapse, calibrating the value‑function collapse simulator with real parameter estimates should reproduce observed collapse trajectories better than naive extrapolation.

  7. Representation chain depth and democratic satisfaction: Democracies with representation chains exceeding 2–3 layers will exhibit lower citizen satisfaction with democracy and weaker preference‑policy congruence than those with shorter chains.

These predictions are specific enough to be wrong. That is their value: they convert the framework from a way of seeing into a set of claims that can be tested, refined, or refuted by evidence.

7.6 Invitation

What has been established: The paper establishes a conceptual framework and a formal structure. It shows that objective functions are observation architectures (Part II), that low-dimensional observation creates structural blindness (Parts I–III), and that specific exclusions (truth, meaning, wellbeing, relational integrity) accelerate gap growth (Part IV). It demonstrates that disparate governance failures can be re-interpreted using a unified vocabulary (Part V) and specifies institutional mechanisms that would, in principle, enable value evolution (Part VI).

What has not been established: The framework has not been empirically validated. The country case re-interpretations are consistent with the framework but do not test it. The measurement protocols exist but have not been implemented. The quantitative claims (G ≈ 2–3, G_crit ≈ 2–3) are illustrative, not measured. The dynamic model is conceptual, not calibrated.

The boundary between contribution and aspiration: The contribution is a way of seeing governance failures—a structured vocabulary and formal apparatus that makes certain patterns visible. The aspiration is that this way of seeing will prove empirically grounded once the measurement work is done. The paper cannot claim to have completed that work, only to have specified what it would require.

The simulations, the formal derivations, and the country analyses presented across the Governance as Engineering series and this paper constitute a diagnostic instrument. They generate testable predictions: about the relationship between value dimensionality and collapse risk, about the growth dynamics of the variety gap under different adaptation regimes, about the performance effects of specific meta‑governance institutions. The predictions await empirical testing.

The paper closes, therefore, not with a declaration but with an invitation. The invitation is to treat the variety gap not as a metaphor but as a variable — to measure it, to model it, to test its consequences, and to design the institutions that might keep it from crossing the threshold at which a civilisation can no longer see the sources of its own fragility.

The work ahead is substantial. It will require collaboration across control theory, complexity science, political economy, institutional design, and the many domains of value theory that this paper has only begun to integrate. It will require institutional experiments — value audits in real governance settings, deliberative dimension‑surfacing bodies with genuine mandates, pre‑emptive dissolution protocols tested at manageable scales — whose outcomes cannot be guaranteed but whose urgency can be demonstrated.

What the framework provides, at this stage, is a starting point that is rigorous enough to be wrong in specific, identifiable ways, and therefore capable of being improved. If the variety‑gap mechanism withstands empirical testing, it will offer governance systems something they have never had: a formal account of why what they optimize for determines what they can perceive, why that limitation eventually destroys them, and what they might build to transcend it before the gap becomes a grave.


Appendix A: Formal Derivation of the Minimum Value Dimensionality Condition (Static)

This appendix formalizes the extension of Ashby’s Law of Requisite Variety from physical controllers to value architectures, yielding the condition dim(V) ≥ dim(D) − dim(G) used in the main text. The derivation is static: it treats the disturbance space and value architecture as fixed, without modelling their temporal evolution (see Appendix B for the dynamic extension).

A.1 System, Disturbance, and Goal

Consider a system S whose state at any time is a vector xX, where X is a finite‑dimensional vector space over the reals. The system is subject to a disturbance vector dD, where D is the disturbance space. The system’s dynamics are not modelled directly; we abstract them into the mapping from disturbances to outcomes.

A governance controller (a value architecture) attempts to keep the system within a designated goal set GX. The goal set represents the acceptable states of the world as defined by the value architecture. For example, if the value architecture tracks GDP and unemployment, G is the set of states where both are within acceptable bounds.

The controller does not observe the full state x. It observes a projection:

y = C x + ε

where C: XY is a linear observation matrix and ε is noise. The choice of C is determined by the value architecture: it selects which dimensions of the state space are operationally visible.

A.2 Variety as Dimensionality

Ashby defined variety as the logarithm of the number of distinguishable states. In a continuous state space, we adapt this as the effective dimensionality — the rank of the relevant vector space. Specifically:

  • dim(D) = rank of the disturbance space: the number of independent ways the system can be pushed away from its goal.
  • dim(G) = rank of the goal set: the number of independent directions in which the system is allowed to vary and still be considered “acceptable.” If the goal is a single point, dim(G) = 0.
  • dim(V) = rank of the observation space Y, i.e., the number of independent signal dimensions the value architecture can distinguish.

This is a simplification: real disturbances may be nonlinear, non‑Gaussian, and dynamically coupled. The rank condition captures the linear case; extensions are possible but beyond the present scope.

A.3 Ashby’s Law in Dimensional Form

Ashby’s Law in its original formulation: V(R) ≥ V(D) − V(G), where V(·) is variety. Mapping variety to dimensionality (for sufficiently regular spaces, taking variety as the logarithm of the number of distinguishable states, variety scales with rank), we obtain:

dim(V) ≥ dim(D) − dim(G)  (1)

This is the static requisite variety condition for a controller whose observation channel has rank dim(V). It states: the number of independent signal dimensions the controller can observe must be at least the number of independent disturbance dimensions minus the number of independent dimensions the system is allowed to occupy within the goal set.

If dim(V) < dim(D) − dim(G), there exist disturbance dimensions that lie in the nullspace of the observation matrix C. Those disturbances can push the system out of the goal set without the controller ever registering a deviation, because the controller’s observation space is orthogonal to them.

A.4 Application to Value Architectures

A value architecture functions as the controller in this schema. It is defined by an objective function J(x) that is minimized or maximized, but for the purposes of stability, the relevant property is which deviations from the desired state are visible as costs. The effective observation matrix C of the value architecture selects those dimensions of the state that enter the objective function.

A value architecture with dim(V) = k tracks k independent dimensions of the system’s state and is blind to the rest. The minimum dimensionality condition (1) becomes:

dim(Value Architecture) ≥ dim(Disturbance Space) − dim(Goal Set)

In the main text, this is simplified to dim(V) ≥ dim(D) − dim(G), with the understanding that dim(D) — the effective dimensionality of the disturbance environment — is large and open‑ended in practice.

A.5 Interpretation and Caveats

This derivation provides a conceptual bridge from Ashby’s Law to the variety gap. It is not an operational measurement protocol. The key limitations are:

  1. Linearity: Real observation channels are nonlinear. The rank condition captures first‑order information loss; higher‑order interactions between dimensions are not modelled.

  2. Dimensionality estimation: dim(D) and dim(G) are not directly observable in most governance contexts. Estimating the effective dimensionality of a disturbance environment requires time‑series analysis of historical shocks, which is feasible in principle but nontrivial.

  3. Static assumption: The condition says nothing about how dim(D) or dim(V) change over time. It applies to a fixed snapshot. The dynamic case, where dim(D) expands and dim(V) must adapt, is treated in Appendix B.

  4. Goal set dimensionality: The term dim(G) can be misinterpreted. If the goal set is a single point (e.g., exactly 2% inflation), dim(G) = 0 and the condition is dim(V) ≥ dim(D). If the goal allows a wide range of acceptable variation, dim(G) is larger and the requirement on dim(V) is relaxed. This captures the intuition that a system with loose goals needs less precise observation.

Subject to these limitations, equation (1) expresses the architectural insight of the paper in a compact, falsifiable form: a value architecture that tracks too few dimensions relative to the disturbance environment it faces is structurally incapable of stabilizing the system it governs. The variety gap G = dim(D) − dim(G) − dim(V) quantifies the deficit; when G > G_crit, the system crosses the dissolution threshold described in Part III.


Appendix B: Extension to Time‑Varying Dimensionality — Dynamics of the Variety Gap and the Dissolution Threshold

Appendix A treated the disturbance space D and the value architecture V as static, yielding a snapshot condition: dim(V) ≥ dim(D) − dim(G). But the effective dimensionality of the disturbance environment is not fixed. New technologies, environmental changes, social reconfigurations, and geopolitical shifts continuously introduce new dimensions of variation that governance systems must navigate. This appendix extends the static condition to the case where both dim(D) and dim(V) can vary over time, formalizing the heuristic model dG/dt = α − β · A(V) used in Part III and deriving the dissolution threshold condition.

B.1 Time‑Varying Dimensionality

Let dim(D)(t) denote the effective dimensionality of the disturbance space at time t, and dim(V)(t) the effective dimensionality of the value architecture at time t. The goal set dimensionality dim(G) is assumed fixed for simplicity — the set of acceptable outcomes is treated as a constitutional constant, though in practice it too can evolve.

The variety gap at time t is:

G(t) = dim(D)(t) − dim(G) − dim(V)(t)

The static condition G ≤ 0 (or G < G_crit) is now a moving target. A system that satisfies the condition at t₀ may violate it at t₁ if dim(D) grows faster than dim(V). The evolutionary pressure on governance architectures arises precisely from this dynamic: the ground shifts beneath them.

B.2 Dynamics of the Disturbance Space

The expansion of dim(D) is driven by the emergence of what Kauffman (2000) terms the “adjacent possible” — novel states and interactions that were not previously reachable. In governance terms, new disturbance dimensions emerge through mechanisms including:

  • Technological change: digitization introduces cybersecurity, epistemic integrity, and algorithmic fairness as governance dimensions that did not exist in the pre‑digital era.
  • Environmental change: climate change introduces carbon budgets, adaptation finance, and managed retreat as dimensions of public policy.
  • Social change: demographic transition, urbanization, and cultural pluralization introduce generational equity, spatial justice, and identity recognition as governance dimensions.
  • Interdependence amplification: globalization and networked infrastructure couple previously independent systems, so that disturbances in one domain (energy markets, supply chains, information ecosystems) propagate into others, increasing the effective dimensionality of the combined disturbance space (Taleb, 2012).

We model this expansion as:

dim(D)(t) = dim(D)(0) + ∫₀ᵗ α(s) ds

where α(s) is the instantaneous emergence rate of new disturbance dimensions at time s. In general, α(s) is non‑negative and likely non‑stationary — periods of rapid technological or geopolitical change produce higher α. The simplest tractable case, used in the main text, assumes α is approximately constant over the relevant time horizon, yielding:

dim(D)(t) = dim(D)(0) + α t

B.3 Dynamics of the Value Architecture

The value architecture can also expand its dimensionality over time — through the addition of new metrics, the creation of new governance institutions, or the surfacing of previously excluded values through political mobilization or deliberative processes (Dryzek, 2000). We model this expansion as:

dim(V)(t) = dim(V)(0) + ∫₀ᵗ β(s) · A(V)(s) ds

where:

  • A(V)(s) is the adaptation effort at time s — the resources and political will devoted to expanding the value architecture.
  • β(s) is the adaptation efficiency — the fraction of adaptation effort that successfully translates into an increase in effective dimensionality. β may be less than 1 due to institutional friction, capture of reform processes, or the intrinsic difficulty of perceiving dimensions that the existing architecture excludes.

Combining these, the dynamics of the variety gap are:

dG/dt = α(t) − β(t) · A(V)(t)  (2)

This is the formal counterpart to the heuristic equation in Part III. The gap grows when the emergence rate of new disturbances exceeds the rate at which the value architecture expands its dimensionality. The gap shrinks when adaptation outpaces emergence.

B.4 The Critical Dissolution Threshold

Not all positive values of G are catastrophic. A system can function with a moderate variety gap, absorbing the unobserved variance as unexplained noise, provided the signal from the observed dimensions remains dominant. Catastrophe occurs when the gap exceeds a critical threshold G_crit at which the signal‑to‑noise ratio in the value channel falls below unity.

To formalize G_crit, we must relate variety gap to information loss. The observation channel y = Cx + ε transmits information about the true state x at a rate bounded by the channel capacity (Shannon, 1948). As G increases — as more disturbance dimensions fall into the nullspace of C — the mutual information between x and y decreases. The SNR in the value channel is a decreasing function of G.

Following the framework of Paper III, we define G_crit as the value of the gap at which:

I(x; y) ≤ I(ε; y)

where I(x; y) is the mutual information between the true state and the observation, and I(ε; y) is the mutual information between the noise and the observation. Informally: the information the observation carries about reality is no greater than the information it carries about the noise structure of the channel. Beyond this point, the system’s observations are more informative about the properties of its own measurement apparatus than about the world it must govern.

For linear Gaussian channels, this condition reduces to the SNR threshold familiar from signal processing: the signal variance falls below the noise variance. The precise value of G_crit depends on the channel structure C and the noise covariance, but the qualitative point is robust: there exists a threshold beyond which the observation channel is constitutionally uninformative.

B.5 Conditions for Managed vs. Unmanaged Gap Growth

Equation (2) yields a direct condition for viability:

  • Managed regime: β(t) · A(V)(t) ≥ α(t). The variety gap is stable or shrinking. The system maintains perceptual contact with its environment.
  • Unmanaged regime: β(t) · A(V)(t) < α(t). The variety gap grows. The system progressively loses observability of the disturbance dimensions that will eventually determine its fate.

In the unmanaged regime, G(t) increases monotonically. Unless the regime shifts — either α falls (the disturbance environment simplifies) or β · A(V) rises (adaptation accelerates) — G(t) will eventually cross G_crit. The time to dissolution is:

T_diss = (G_crit − G(0)) / (α − β · A(V))

This is the time remaining before the value architecture becomes structurally incapable of perceiving existential threats. The governance implication is direct: if T_diss is shorter than the timescale required for institutional reform, the system faces a forced dissolution — collapse — rather than a managed transition.

B.6 Relationship to Empirical Phenomena

This dynamic formalism captures the trajectory described in the country reports:

  • In Japan, α was low relative to the post‑war decades, but β · A(V) was even lower — the value architecture actively resisted dimensional expansion because stability was the sole metric. G grew slowly but steadily, and the system now approaches dissolution through gradual freezing rather than acute collapse.
  • In Russia, α was moderate but β · A(V) was sharply negative — the value architecture was actively destroying its own observational capacity. G spiked rapidly, crossing G_crit in a compressed timeframe.
  • In the UK, α increased through post‑industrial restructuring and digital transformation, while β · A(V) was damped by the centralization dynamics of the Westminster model and the Treasury orthodoxy. G grew through the accumulation of delivery failures and democratic disconnection.
  • In the EU, α increased sharply with the polycrisis, while β · A(V) remained low due to the negotiation‑dilution architecture. G widened until coherence became structurally unachievable.

B.7 Caveats and Open Problems

This dynamic extension is a conceptual scaffold, not a calibrated model. Significant limitations include:

  1. Measurement of α and β: The emergence rate of new disturbance dimensions and the adaptation efficiency of value architectures are not currently measurable with precision. Estimating them requires longitudinal analysis of policy domains, which is methodologically challenging but possible in principle.

  2. Linearity of the dynamics: Equation (2) is first‑order and linear. Real systems exhibit threshold effects in both α (disturbances can emerge in cascades) and β (adaptation may become easier or harder as G changes). Nonlinear extensions are required for realistic modelling.

  3. Endogeneity of α: The disturbance emergence rate is not purely exogenous. A governance system that actively explores its environment — through experimentation, monitoring, and deliberative surfacing — may discover new dimensions earlier, effectively increasing α in the short term but enabling earlier adaptation. The relationship between exploration and disturbance emergence is complex.

  4. Goal set evolution: The model treats dim(G) as fixed. In practice, societies periodically renegotiate what counts as acceptable — in constitutional moments, through social movements, or through crisis. Incorporating goal set dynamics would add a third differential equation to the system.

  5. Fractal structure: The model aggregates all governance scales into a single G. A more complete treatment would decompose G by scale, recognizing that local systems may maintain observability of dimensions that are invisible to national systems, and vice versa — the fractal value architecture described in Part VI.

Subject to these limitations, Appendix B provides the formal backing for the paper’s central dynamic claim: in a changing world, a static value architecture allows the variety gap to grow, and when that gap crosses a critical threshold, dissolution — managed or forced — becomes structurally inevitable. The only way to avoid this trajectory is to maintain an adaptive capacity that matches the rate at which the environment generates novelty. The meta‑governance institutions proposed in Part VI are designed to operationalize exactly this capacity.


Appendix C: Simulation Architecture for Value‑Function Collapse

This appendix defines a minimal dynamical model that makes the Goodhart‑Ashby synthesis and the variety gap concretely visible. The simulation is deliberately simple so that the structural mechanism remains transparent.

C.1 System Description

Consider a society with two coupled state variables:

  • W(t) : economic output (wealth), the observed dimension.
  • E(t) : environmental integrity (ecosystem health), the excluded dimension.

The system evolves in discrete time steps according to:

W(t+1) = W(t) + α · E(t) · I(t) − δ_W · W(t) E(t+1) = E(t) − β · I(t) + γ · (E₀ − E(t)) + η · W(t)

where:

  • I(t) is the control input (economic investment) chosen by the policy system.
  • α translates current environmental quality into the productivity of investment. As E degrades, the same I yields less W in the future.
  • δ_W is the natural depreciation of wealth.
  • β is the environmental cost per unit of investment.
  • γ is the natural regeneration rate of the environment toward its baseline E₀.
  • η captures a delayed negative feedback: high past wealth (which implies past investment) eventually erodes the environment further (e.g., through accumulated pollution, resource depletion).

Crucially, the coupling works in both directions: E supports W, but the pursuit of W degrades E, and a degraded E eventually reduces future W.

C.2 Value Architectures (Controllers)

We compare two governance architectures that differ only in their value function dimensionality, not in their competence.

Architecture 1D (GDP‑only)

  • Objective function: J₁ = W(t).
  • The controller observes W(t) (with some noise) and does not observe E(t). It believes maximising W is always good.
  • Control law: I(t) = I₀ + K · (W_target − W_obs(t)), where I₀ is a baseline and K is a gain. The controller invests more when W is below the desired target, trying to push W upward.

Architecture 2D (Wellbeing‑aware)

  • Objective function: J₂ = W(t) + λ · E(t) (with λ > 0).
  • The controller observes both W(t) and E(t). It recognises that E has value and that degrading E harms future W.
  • Control law: I(t) is chosen to keep both variables within a desired region. Concretely, the investment is damped when E falls below a threshold: I(t) = I₀ + K · (W_target − W_obs(t)) · f(E), where f(E) is a sigmoid that reduces investment as E declines, preventing the damaging feedback loop from being triggered.

Both controllers have access to the same financial resources; the only difference is the dimensionality of their value architecture.

C.3 Parameterisation

ParameterValueMeaning
α0.3Investment productivity per unit of E
δ_W0.05Wealth depreciation
β0.25Environmental cost per unit of I
γ0.1Environmental regeneration rate
η0.02Delayed damage from past wealth
E₀100Baseline environmental integrity
W_target120Desired wealth level
I₀5Baseline investment
K2.0Gain (identical for both architectures)
λ1.5Weight of environment in 2D objective
Noise σ_W, σ_E1.0, 0.5Observation noise (1D only observes W)

Initial conditions: W(0)=60, E(0)=90.

C.4 Expected Behaviour

Architecture 1D initially succeeds: investment raises W, and because E is still healthy, productivity is high. The controller “learns” that investment is effective and continues to push W toward the target. Meanwhile, E degrades silently because it is not observed. As E falls, the productivity of investment drops (α·E decreases), so more I is needed to maintain W, which accelerates E’s decline. Eventually, the accumulated environmental debt triggers a sharp fall in W that the controller cannot understand—its own actions caused the collapse, but its value architecture gave it no category in which to perceive E as a relevant variable. The trajectory shows a classic overshoot‑and‑collapse pattern.

Architecture 2D, observing E, begins to moderate investment as E approaches dangerous levels. W grows more slowly but never collapses. The system reaches a stable, lower steady state where both dimensions are balanced.

C.5 Relevance to the Variety Gap

This simulation is a direct instantiation of the Goodhart‑Ashby synthesis:

  • The 1D objective function is an observation channel of dimensionality dim(V)=1. It projects the full state space (W, E) onto a single axis.
  • The excluded dimension E is causally coupled to the target W. Optimizing the proxy W without monitoring E eventually destroys the correlation that made W a good proxy.
  • The collapse follows the variety gap logic: G = dim(R) − dim(V) = 2 − 1 = 1 > 0. The gap grows as E deteriorates, and when the coupling feeds back, the system’s own optimization logic created the crisis it could not foresee.

The same mechanism underlies the country‑level failures described in Part V: each case is a higher‑dimensional version of this basic loop.

C.6 Reproducibility

The Python script that generates the simulation and the visualisation is available in the companion repository (see “Simulation Code” in the supplementary materials). The script uses standard NumPy and Matplotlib; no proprietary packages are required.

Figure C.1: Value-function collapse in a minimal two-state system

Figure C.1

The 1D controller (observing only W) initially succeeds, driving wealth to ~1000 by aggressive investment. This depletes environmental integrity E to near-zero. Once E collapses, productivity (α·E·I) vanishes and the system enters terminal decline—W falls to zero despite continued control effort. The controller cannot perceive the environmental degradation that caused its own failure; the excluded dimension returns as inexplicable collapse.

The 2D controller (observing both W and E) moderates investment when E declines, maintaining both variables at degraded but stable levels (W≈37, E≈11). The system never reaches the 1D target of W=120, but it survives.

The phase portrait (bottom left) shows the trajectories in state space: 1D spirals to system death at the origin, while 2D finds a low-equilibrium attractor. The critical finding (top right): even measured by the 1D objective function (W alone), the 2D architecture outperforms after t≈100. The GDP-only system optimizes away its own ability to generate GDP.

This is the Goodhart-Ashby synthesis in its simplest form: a value architecture with dim(V)=1 cannot maintain stability in a system with dim(R)=2 when the dimensions are causally coupled. The hysteresis mechanism (degraded ecosystems regenerate at 20% normal rate) reflects ecological reality and ensures the differentiation is permanent, not transient.


Appendix D: Country Report Variety‑Gap Estimation Table

The following table provides illustrative estimates of the variety gap for the governance architectures analysed in the Country Reports series. The values for dim(V), dim(R), and G are heuristic and intended to make the framework tangible, not to serve as precise empirical measurements. The G_crit status column indicates whether the estimated gap exceeds the critical threshold at which observability collapses, as discussed in Part III and Appendix B. The collapse mode describes the characteristic way the excluded dimensions re‑enter as systemic crises.

Country / SystemCore Value OptimizedApprox. dim(V)Key Excluded dim(R)Estimated dim(R) − dim(G)GG_crit StatusCollapse Mode
JapanStability / Continuity1Adaptive capacity, renewal, demographic dynamism≥ 3≥ 2> G_critGradual systemic freezing (demographic stagnation, zombie firms, dignified decline)
RussiaControl / Regime survival1Truth, distributed intelligence, legitimacy≥ 4≥ 3≫ G_critStrategic blindness → sudden shocks (Control–Blindness–Shock Loop)
United KingdomCentralized delivery / Control appearance1Local context, relational trust, stress‑distribution infrastructure≥ 4≥ 3> G_critImplementation failure, democratic disconnection (Centralise‑Fail‑Centralise)
BrazilCoalition survival / Governability1Citizen preferences, democratic accountability, spatial equity≥ 4≥ 3> G_critBreakthrough‑Capture cycles, accumulation deficit
European UnionMember‑state consensus1Speed, spatial coherence, temporal alignment≥ 3≥ 2> G_critPolycrisis, Negotiation‑Dilution spiral
United StatesIntegration / Federal coordination~2 (federalism distributes some variety, but integration is missing)System‑wide coherence, cross‑state learning, distributive justice≥ 3≥ 1> G_critEscalate‑Block‑Bypass‑Delegitimise spiral
GermanyExecution / Policy implementation~1 (engineering rigour focuses on implementation quality)Strategic agility, risk capital, digital transformation≥ 3≥ 2> G_critParalysed spending, implementation gap
FranceIntegration / Social cohesion~1 (Jacobin uniformity)Reform sustainability, peripheral integration, feedback from implementation≥ 3≥ 2> G_critReform‑explosion‑retreat cycle
SwedenFeedback / Sensemaking~1 (consensus, saklighet)Fast sensing, timely response, cross‑silo integration≥ 2≥ 1Approaching G_critDrift loop (signal suppression, delayed adaptation)
FinlandForesight / Anticipatory capacity~2 (strong foresight, but throughput constrained)Transformation speed, paradigm replacement capacity≥ 3≥ 1Approaching G_critThroughput Constraint (can see future, cannot reach it in time)
IndiaSynchronisation / Multi‑scale coordination~1 (centralism and informal adaptation)Formal institutional capacity, spatial and temporal synchronisation≥ 4≥ 3> G_critLeap‑lag cycles, informal compensation

Note on estimation: The values in this table are not derived from empirical measurement. They represent plausible order‑of‑magnitude judgments consistent with the detailed country reports. The purpose is to illustrate the variety‑gap logic across diverse governance architectures and to motivate the empirical research that would replace these heuristics with measured quantities. The central claim of the paper — that low‑dimensional value architectures allow the variety gap to widen past the critical threshold — does not depend on the precision of these specific numbers. It depends on the structural relationship they illustrate.


Appendix F: Annotated Reference List

This appendix provides a structured guide to the key works that inform The Variety Gap. The references are organized by thematic cluster, corresponding to the paper’s main argumentative moves. For each entry, a brief annotation explains its relevance and the section(s) where it is most naturally cited. The tags [R], [I], and [S] indicate whether the reference primarily supports the rigorous core, the interpretive bridging, or the speculative/philosophical layer of the paper. This categorization is intended to help the author insert citations with an appropriate level of epistemic commitment.


F.1 Foundational Cybernetics, Control Theory, and Information Theory

These works underpin the engineering grammar established in Papers I–V and the formal machinery of Parts I–III of the present paper.

  • Ashby, W. R. (1956). An Introduction to Cybernetics. Chapman & Hall.
    The canonical statement of the Law of Requisite Variety. Foundational for the argument that any regulator must match the variety of the system it governs (Parts I, II, III). [R]

  • Beer, S. (1972). Brain of the Firm. Allen Lane.
    Applies Ashby’s variety engineering to organizational design via the Viable System Model. Supports the fractal architecture argument in Paper II and the meta‑governance discussion in Part VI. [R/I]

  • Conant, R. C. & Ashby, W. R. (1970). “Every Good Regulator of a System Must Be a Model of That System.” International Journal of Systems Science, 1(2), 89–97.
    Formal proof that effective regulation requires internal modelling capacity. Directly supports the claim that objective functions must track the dimensionality of the governed system (Part II). [R]

  • Shannon, C. E. (1948). “A Mathematical Theory of Communication.” Bell System Technical Journal, 27, 379–423, 623–656.
    Establishes channel capacity and the limits of information transmission. Underpins the SNR threshold argument in Paper III and the dissolution threshold in Part III. [R]

  • Wiener, N. (1948). Cybernetics: Or Control and Communication in the Animal and the Machine. MIT Press.
    The founding text of cybernetics, establishing feedback as a universal principle across biological, mechanical, and social systems. Provides the intellectual lineage for treating governance as control (Part I). [R]


F.2 Objective Functions as Observation Architectures and the Goodhart–Ashby Synthesis

This cluster supports the paper’s central move: treating value metrics as observation channels whose dimensionality determines perceptual capacity.

  • Goodhart, C. A. E. (1975). “Problems of Monetary Management: The U.K. Experience.” In Papers in Monetary Economics, Reserve Bank of Australia.
    The original statement of Goodhart’s Law. Used as the departure point for the Goodhart–Ashby synthesis in Part II. [R/I]

  • Strathern, M. (1997). “‘Improving Ratings’: Audit in the British University System.” European Review, 5(3), 305–321.
    Classic anthropological account of how metrics reshape the realities they are meant to measure. Illustrates the Goodhart mechanism in non‑economic domains (Part II). [I]

  • Manheim, D. & Garrabrant, S. (2018). “Categorizing Variants of Goodhart’s Law.” arXiv preprint arXiv:1803.04585.
    Formal taxonomy of Goodhart effects, including regime drift. Supports the generalization from gaming to structural blindness (Part II). [R]

  • Amodei, D., Olah, C., Steinhardt, J., Christiano, P., Schulman, J., & Mané, D. (2016). “Concrete Problems in AI Safety.” arXiv preprint arXiv:1606.06565.
    Identifies reward hacking and objective misspecification as core AI alignment problems. The structural analogue to value‑architecture collapse in governance systems (Part II). [R/I]

  • Müller, J. Z. (2018). The Tyranny of Metrics. Princeton University Press.
    Historical and institutional analysis of how metric fixation distorts organizational behaviour. Provides empirical grounding for the claim that low‑dimensional objectives blind institutions (Parts II, IV). [I]


F.3 Variety Gap Dynamics, Dissolution, and Evolutionary Systems

These sources inform the modelling of G, the dissolution threshold, and the open‑ended nature of disturbance environments.

  • Taleb, N. N. (2012). Antifragile: Things That Gain from Disorder. Random House.
    Argues that systems exposed to volatility must expand their response capacity or collapse. Underpins the dynamic of the variety gap and the dissolution argument (Part III). [I/S]

  • Kauffman, S. A. (2000). Investigations. Oxford University Press.
    Introduces the “adjacent possible” — the idea that new dimensions of possibility emerge continuously in complex systems. Supports the claim that dim(R) is open‑ended (Part III). [I/S]

  • Gould, S. J. & Eldredge, N. (1977). “Punctuated Equilibria: The Tempo and Mode of Evolution Reconsidered.” Paleobiology, 3(2), 115–151.
    The classic statement of punctuated equilibrium: long periods of stability interrupted by rapid change. Analogous to the dissolution‑and‑reform dynamic of value architectures (Part III). [I]

  • Meadows, D. H. (2008). Thinking in Systems: A Primer. Chelsea Green.
    Accessible introduction to stocks, flows, feedback, and leverage points. Useful for grounding the systems‑dynamic intuition of the gap model (Parts I, III). [I]


F.4 The Missing Dimensions: Wellbeing, Meaning, Social Cohesion, and Ecological Integrity

This cluster grounds the argument that certain excluded dimensions are not optional but structurally necessary.

  • Stiglitz, J. E., Sen, A., & Fitoussi, J.-P. (2009). Report by the Commission on the Measurement of Economic Performance and Social Progress. French Government.
    Formal critique of GDP as a welfare metric. Supports the argument that single‑metric value architectures systematically exclude wellbeing dimensions (Part IV). [R/I]

  • Wilkinson, R. & Pickett, K. (2009). The Spirit Level: Why More Equal Societies Almost Always Do Better. Allen Lane.
    Empirical demonstration that social ills track inequality, not average income. Shows that excluded social dimensions re‑enter as health and cohesion crises (Part IV). [I]

  • Raworth, K. (2017). Doughnut Economics: Seven Ways to Think Like a 21st-Century Economist. Random House.
    Proposes a multi‑dimensional economic framework bounded by social and planetary thresholds. An applied instance of expanding value dimensionality (Part IV). [I]

  • Ostrom, E. (1990). Governing the Commons: The Evolution of Institutions for Collective Action. Cambridge University Press.
    Documents how communities manage common resources through polycentric, multi‑dimensional governance. Grounds the requisite variety argument for commons management in Paper IV and Part IV. [R/I]

  • Weaver, W. (1948). “Science and Complexity.” American Scientist, 36, 536–544.
    Classic distinction between problems of simplicity, disorganized complexity, and organized complexity. Provides historical framing for the dimensionality challenge (Part II). [I]


F.5 Meta‑Governance, Value Evolution, and Second‑Order Cybernetics

Sources that inform the design of institutions capable of evolving their own value architectures.

  • von Foerster, H. (1984). Observing Systems. Intersystems Publications.
    Foundational text of second‑order cybernetics: observing the observer. Directly underpins the meta‑governance argument in Part VI. [R/I]

  • Beer, S. (1979). The Heart of Enterprise. John Wiley.
    Extends the Viable System Model to the meta‑level governance of the organization. Supports the design principles for value‑evolving institutions (Part VI). [R/I]

  • Luhmann, N. (1995). Social Systems. Stanford University Press.
    Theory of autopoietic social systems that produce their own elements. Provides a sociological framework for understanding how value architectures reproduce themselves and resist change (Part VI). [I/S]

  • Habermas, J. (1996). Between Facts and Norms: Contributions to a Discourse Theory of Law and Democracy. MIT Press.
    Argues that legitimate law requires deliberative procedures that allow new claims and perspectives to surface. Supports the role of citizens’ assemblies and deliberative bodies in value evolution (Part VI). [I]

  • Dryzek, J. S. (2000). Deliberative Democracy and Beyond: Liberals, Critics, Contestations. Oxford University Press.
    Systematic defence of deliberative institutions as mechanisms for surfacing excluded perspectives. Applies directly to the meta‑governance design in Part VI. [I]

  • Bateson, G. (1972). Steps to an Ecology of Mind. University of Chicago Press.
    Explores the systemic nature of learning, perception, and “the difference that makes a difference.” Influences the reframing of meaning and connection as informational dimensions (Parts IV, VI). [I/S]

  • Peirce, C. S. (1931–1958). Collected Papers of Charles Sanders Peirce, vols. 1–8. Harvard University Press.
    Introduces the concept of the “unlimited community” of inquiry and the asymptotic nature of truth. Reframes wholism as an open‑ended process of inquiry; underpins the “infinite ascent” framing in Part VI. [S]


F.6 Country Case Illustrations

These works provide empirical grounding for the country reports re‑interpreted in Part V.

  • The Governance as Engineering Series (Papers I–V) and the accompanying Country Reports (Germany, France, Sweden, India, EU, UK, Brazil, USA, Finland, Japan, Russia).
    The primary empirical base. Each report provides the specific diagnosis of a value‑architecture failure mode. Cited extensively in Part V. [R/I]

  • Gilens, M. & Page, B. I. (2014). “Testing Theories of American Politics: Elites, Interest Groups, and Average Citizens.” Perspectives on Politics, 12(3), 564–581.
    Empirical demonstration that average citizen preferences have near‑zero influence on policy in the U.S. Supports the preference‑invisibility claim in the general argument and the Brazil/UK cases (Part V). [I]

  • Food and Agriculture Organization (FAO). (2022). The State of World Fisheries and Aquaculture 2022. Rome: FAO.
    Documents global fisheries status and the persistent failure of centralized management. Grounds the observational‑inadequacy argument in Paper IV and the commons dimension of Part IV. [R/I]

  • Bevir, M. & Rhodes, R. A. W. (2003). Interpreting British Governance. Routledge.
    Analyzes the hollowing‑out of the British state and the rise of governance through networks. Supports the UK diagnosis in Part V. [I]

  • Scalia, L. (2020). The Brazilian Coalitional Presidentialism: The Political Economy of Governance. Routledge (or comparable source on presidencialismo de coalizão).
    Analysis of Brazil’s coalitional presidential system and its capture dynamics. Grounds the Brazil case in Part V. [I]

  • Gel’man, V. (2015). Authoritarian Russia: Analyzing Post-Soviet Regime Changes. University of Pittsburgh Press.
    Examines the centralization of power and the suppression of feedback in contemporary Russia. Supports the Russia diagnosis in Part V. [I]


Appendix G: Operational Definitions and Measurement Protocols

This appendix provides concrete measurement protocols for the framework’s key variables, specifies when terms are used rigorously versus heuristically, and establishes a measurement ladder from most to least operationalized.

G.1 The Operationalization Challenge

The framework’s core variables—dim(V), dim(R), G, G_crit—are defined formally in Appendices A and B using linear algebra (rank of observation matrices, disturbance spaces). These definitions are mathematically precise but not directly measurable in real governance systems. This appendix bridges the gap between formal definition and empirical measurement.

The three-tier epistemic structure:

  1. Rigorously operationalized: Measurable from administrative data with defined protocols
  2. Operationalizable in principle: Clear measurement procedure exists but requires resources/access not currently available
  3. Heuristic: Used to organize qualitative evidence; order-of-magnitude estimates only

Throughout the main text, we now mark which tier each usage belongs to.


G.2 Dimensionality of Value Architecture — dim(V)

Formal definition (Appendix A): Rank of the observation matrix C in y = Cx + ε, where y is the signal that reaches decision-makers.

Operational protocol 1 — Policy objective count (Tier 1: Rigorous)

For a governance system with explicit policy objectives:

dim(V) ≥ number of independent objectives tracked in:
  - Budget allocation categories that receive >1% of total budget
  - Performance indicators monitored in annual reports
  - Statutory mandates in enabling legislation
  - Explicit targets in coalition agreements / party platforms

Independence test: Two objectives are independent if changing one does not mechanically determine the other. GDP growth and unemployment rate are correlated but independent (both can change). “Reduce poverty” and “increase median income” are not fully independent—the first partially determines the second.

Worked example — UK Treasury:

  • Fiscal sustainability (debt-to-GDP ratio) — 1 dimension
  • Economic growth (GDP growth rate) — 1 dimension
  • Employment (unemployment rate) — 1 dimension
  • Inflation target (CPI) — 1 dimension

Estimated dim(V) = 4 for economic policy.

But this likely overstates effective dimensionality because:

  • All four are subordinated to “maintain City of London confidence”
  • Trade-offs are resolved by a single meta-objective (financial stability)
  • Effective dim(V) closer to 2

Operational protocol 2 — Time-series principal component analysis (Tier 2: In principle)

For a governance system with observable policy outputs over time:

1. Construct time series of n policy variables (budget allocations, 
   regulatory stringency indices, enforcement actions) across T time periods
2. Compute correlation matrix
3. Perform PCA, retain components explaining >5% of variance
4. dim(V) = number of retained principal components

This reveals the effective degrees of freedom in how the system actually varies its outputs, not just what it claims to optimize.

Operational protocol 3 — Information-theoretic (Tier 2: In principle)

For a governance system with discrete decision states:

dim(V) ≈ log₂(number of distinguishable decision states) / log₂(number of input states)

This captures how much the system’s outputs compress its inputs—the information bottleneck created by the value architecture.

Current usage in paper: Most country cases use Protocol 1 (objective count) heuristically, yielding dim(V) = 1 or 2. These should be marked as “order-of-magnitude estimates” rather than precise measurements.


G.3 Dimensionality of Disturbance Space — dim(D) or dim(R)

Formal definition (Appendix A): Rank of the disturbance space D—the number of independent ways the system can be pushed away from its goal.

Operational protocol 1 — Historical shock decomposition (Tier 2: In principle)

For a governance system with time-series data on crises:

1. Catalog n governance failures / crises over T time periods
2. For each crisis, code disturbance type across candidate dimensions:
   - Economic (recession, inflation, debt crisis)
   - Social (protests, strikes, demographic shift)
   - Ecological (drought, flood, resource depletion)
   - Geopolitical (war, sanctions, migration)
   - Technological (automation, cyber, epistemic)
   - Institutional (corruption, legitimacy, capacity)
3. Perform factor analysis to identify latent disturbance dimensions
4. dim(D) = number of factors with eigenvalue > 1

Worked example — Eurozone 2008-2023:

  • Financial contagion (sovereign debt) — Factor 1
  • Institutional fragmentation (North-South divide) — Factor 2
  • Democratic legitimacy (populism, turnout collapse) — Factor 3
  • Geopolitical (energy dependence, migration) — Factor 4
  • Estimated dim(D) ≈ 4

Operational protocol 2 — Policy domain enumeration (Tier 3: Heuristic)

For systems without sufficient time-series data:

dim(D) ≥ number of independent policy domains requiring active governance:
  - Economic management
  - Social cohesion
  - Ecological integrity
  - Democratic legitimacy
  - Geopolitical security
  - Technological adaptation
  Each domain scores 1 if it generates disturbances not predictable from the others

Operational protocol 3 — Scenario planning elicitation (Tier 2: In principle)

Structured expert elicitation:

1. Assemble panel of domain experts
2. Generate 50+ "plausible futures" scenarios over 20-year horizon
3. Cluster scenarios by underlying disturbance drivers
4. dim(D) ≈ number of independent clusters

This captures the effective dimensionality of the uncertainty space the system must navigate.

Current usage in paper: Country cases use Protocol 2 (domain enumeration) heuristically. Appendix D table estimates dim(R) - dim(G) in range 2-4 for most cases. These are rough estimates, not measurements.


G.4 The Variety Gap — G

Formal definition (Part III): G = dim(R) - dim(G) - dim(V)

Operational protocol (Tier 2: In principle):

Given measurements of dim(R) and dim(V):

G = dim(R) - dim(V)   (assuming dim(G) is small / negligible)

Interpretation:
  G = 0: Value architecture covers disturbance space
  G = 1-2: Moderate gap, system is blind to 1-2 major disturbance classes
  G = 3+: Large gap, system is structurally vulnerable
  G > G_crit: Constitutional unobservability (see below)

Validation check:

A governance system with variety gap G should exhibit:

  • Recurring crises in the excluded dimensions
  • Policy responses that consistently miss the actual disturbance source
  • Pattern of “unexplained” failures in retrospective analysis

Current usage in paper: G is estimated heuristically in country cases. For most cases, estimated G = 2-3, marked as “approaching or exceeding G_crit.” These should be explicitly labeled as “indicative, not measured.”


G.5 Critical Dissolution Threshold — G_crit

Formal definition (Appendix B): Value of G at which signal-to-noise ratio falls below unity: I(x;y) ≤ I(ε;y)

Operational protocol (Tier 2: In principle):

For Gaussian channels:

G_crit is reached when:
  Var(signal from observed dimensions) ≤ Var(noise from unobserved dimensions)

Measurement:
1. Estimate variance in observed policy indicators (Var_obs)
2. Estimate variance in residual outcomes unexplained by policy (Var_unexplained)
3. If Var_unexplained / Var_obs > 1, system has crossed G_crit

Empirical signature of crossing G_crit:

Systems beyond the threshold exhibit:

  • Policy interventions produce outcomes uncorrelated with intent
  • “Unexplained” variance dominates explained variance in outcome models
  • Governance becomes reactive to phantom signals (noise-tracking)
  • Pattern matches Paper III’s SNR < 1 condition for representation chains

Estimated value:

From Paper III’s representation chain analysis: threshold crossed at 2-3 layers for realistic noise parameters. By analogy, for value architectures:

Provisional estimate: G_crit ≈ 2-3 for most governance contexts

This is highly uncertain and should be treated as order-of-magnitude only.

Current usage in paper: G_crit is used as a qualitative threshold. Country cases marked “approaching” or “exceeding” G_crit based on pattern-matching to expected failure signatures, not direct SNR measurement.


G.6 Disturbance Emergence Rate — α

Formal definition (Appendix B): α(t) is the instantaneous rate of new disturbance dimension emergence: dim(D)(t) = dim(D)(0) + ∫α(s)ds

Operational protocol (Tier 3: Heuristic):

α ≈ (number of new major policy domains in period T) / T

Where "new major policy domain" means:
- Requires dedicated institutional capacity (new ministry/agency)
- Generates disturbances not predictable from existing domains
- Consumes >0.5% of policy bandwidth (legislative time, budget)

Examples:
- Climate adaptation (emerged ~1990s)
- Cybersecurity (emerged ~2000s)  
- Epistemic integrity / disinformation (emerged ~2010s)
- AI governance (emerging ~2020s)

Estimated values:

Based on OECD policy domain growth 1980-2020:

Slow-change baseline: α ≈ 0.1-0.2 new dimensions per decade
Rapid-change periods: α ≈ 0.5-1.0 new dimensions per decade

Current usage in paper: α is used in the dynamic model dG/dt = α - β·A(V) as a conceptual parameter, not a measured quantity. The text should clarify this is illustrative.


G.7 Adaptation Efficiency — β

Formal definition (Appendix B): β(t) is the fraction of adaptation effort that successfully translates into increased dim(V)

Operational protocol (Tier 3: Heuristic):

β = (actual increase in dim(V) over period T) / (intended increase in dim(V))

Measurement challenges:
- "Intended increase" requires clear policy statements
- Institutional reforms often claim to add dimensions without doing so
- Capture/dilution can reduce effective β to near-zero

Estimated ranges:

High-functioning adaptive system: β ≈ 0.5-0.8
  (Sweden's consensus model, Finland's foresight capacity)

Moderate institutional friction: β ≈ 0.2-0.4
  (Germany's coalition consensus, France's reform cycles)

High-capture / high-rigidity: β ≈ 0.0-0.1
  (Russia's vertical, Japan's continuity trap, Brazil's coalitional filter)

Current usage in paper: β is used conceptually in dynamic model, not measured empirically.


G.8 Usage Guidelines for Main Text

To maintain epistemic rigor, the paper should mark variable usage with tier annotations:

Tier 1 (Rigorous): “The UK Treasury’s value architecture tracks four primary objectives [Protocol G.2.1], yielding dim(V) = 4 (rigorous).”

Tier 2 (In principle): “Estimated dim(D) for the Eurozone 2008-2023 is approximately 4 major disturbance dimensions [Protocol G.3.1], though this requires validation through formal factor analysis (in principle).”

Tier 3 (Heuristic): “We estimate dim(V) ≈ 1 for Russia’s control architecture (heuristic). This is an order-of-magnitude judgment based on qualitative analysis, not a measurement.”

For the country cases in Part V:

All variety gap estimates are currently Tier 3 (heuristic). The text should state this explicitly:

"The variety gap estimates in this section are illustrative, based on 
qualitative pattern-matching to the framework's predicted failure modes. 
Empirical validation would require the measurement protocols specified 
in Appendix G."

G.9 Validation Criteria

A claim that dim(V), dim(D), or G has been “measured” rather than “estimated” requires:

For dim(V):

  • Enumeration of explicit policy objectives from primary sources
  • Independence test showing objectives are not mechanically determined by each other
  • Or: PCA on time-series policy data showing retained components

For dim(D):

  • Historical catalog of governance failures/crises
  • Factor analysis or expert elicitation showing independent disturbance dimensions
  • Or: Scenario clustering showing uncertainty space dimensionality

For G:

  • Both dim(V) and dim(D) measured (not estimated)
  • Explicit calculation G = dim(D) - dim(V)

For G_crit crossing:

  • Variance decomposition showing Var(unexplained) > Var(explained)
  • Or: Pattern-matching to expected signatures (reactive governance, phantom signal tracking, uncorrelated policy-outcome relationships) with explicit caveat that this is indicative, not proof

G.10 Research Priorities

To move the framework from heuristic to empirical:

Priority 1: Implement Protocol G.2.2 (PCA on policy time-series) for 3-5 countries with sufficient data

Priority 2: Implement Protocol G.3.1 (historical shock factor analysis) for EU, UK, Japan

Priority 3: Develop automated measurement of dim(V) from budget documents and legislative text using NLP

Priority 4: Test whether estimated G correlates with governance failure frequency in panel data across countries

Priority 5: Empirically calibrate G_crit by identifying SNR thresholds in historical governance collapses

Until these are complete, the framework remains a diagnostic lens rather than a validated predictive model.


Appendix H: Testable Predictions and Falsification Protocols

This appendix operationalizes the framework’s core predictions for empirical testing. Each entry specifies the prediction, the variables involved, measurement approach, data sources, statistical test, and falsification condition.

H.1 Prediction 1: Variety Gap and Crisis Frequency

Prediction: Systems with larger estimated variety gaps (G) will experience more frequent governance crises over a given time period than systems with smaller G, controlling for GDP per capita and regime type. Crises in the excluded dimensions will be disproportionately elevated.

Variables:

  • Independent: G = dim(D) − dim(V), estimated heuristically via the protocols in Appendix G.
  • Dependent: Governance crisis count over 20‑year window (2000‑2020).
  • Covariate: Crisis count in “excluded” vs. “tracked” dimensions (coded per country’s value architecture).
  • Controls: GDP per capita, Polity IV / V‑Dem regime score, population size.

Data sources: Cross‑National Time‑Series Data Archive, V‑Dem crisis indicators, country‑specific value architecture coding (Appendix G protocols).

Test: Negative binomial regression with crisis count as outcome, G as predictor, and controls. A second model tests whether the G‑crisis relationship is stronger for excluded‑dimension crises than for tracked‑dimension crises (interaction term G × excluded dummy).

Falsification: No significant positive coefficient on G, or coefficient negative. Alternatively, no significant interaction with excluded‑dimension dummy.


H.2 Prediction 2: Gap Growth and Institutional Rigidity

Prediction: Countries with higher institutional rigidity will exhibit faster variety‑gap growth (dG/dt) over a 20–30 year window than more adaptive systems.

Variables:

  • Independent: Institutional rigidity index (composite of veto players, constitutional amendment difficulty, mean cabinet duration).
  • Dependent: dG/dt ≈ (change in number of salient policy domains) − (change in number of independent tracked objectives) over the period.
  • Controls: GDP growth, civil society density, media freedom.

Data sources: V‑Dem, Comparative Political Data Set, OECD Government at a Glance, own coding of policy domains (Appendix G.6).

Test: Linear regression of dG/dt on rigidity index with controls. Alternatively, two‑group comparison: high‑rigidity vs. low‑rigidity countries, difference in mean dG/dt.

Falsification: No significant difference in dG/dt between high‑ and low‑rigidity groups, or adaptive systems show faster gap growth.


H.3 Prediction 3: Signature Failure Patterns at G_crit

Prediction: In cases where a governance system plausibly crossed G_crit, time‑series analysis will reveal (a) breakdown of Granger causality from policy interventions to outcomes, (b) increased policy variance relative to outcome variance, (c) spectral evidence that policy responds to high‑frequency noise rather than low‑frequency signal.

Variables:

  • Policy intervention time series (e.g., budget allocations, regulatory changes).
  • Outcome time series (e.g., relevant wellbeing indicators).
  • SNR proxy: ratio of explained to unexplained variance in policy‑outcome models before vs. after the estimated crossing.

Data sources: Country‑specific administrative data, reconstructed for historical cases (e.g., Soviet Union 1985‑1991, UK financial services 2005‑2010, Venezuela 2005‑2015).

Test: Within‑case interrupted time‑series design. Compare pre‑ and post‑estimated‑G_crit periods on: Granger causality tests, variance ratios, spectral coherence.

Falsification: No significant change in these indicators across the estimated G_crit boundary, or changes in the opposite direction (improved policy‑outcome coupling after crossing).


H.4 Prediction 4: Multidimensional Value Architectures and Crisis Reduction

Prediction: Governments or regions that have institutionally adopted multi‑dimensional wellbeing frameworks for at least five years will experience fewer crises in dimensions traditionally excluded by GDP‑centric architectures (health, social cohesion, ecological integrity), relative to matched comparators.

Variables:

  • Treatment: Adoption of a multi‑dimensional wellbeing framework (binary, with implementation‑lag threshold of 5 years).
  • Dependent: Crisis event count in excluded dimensions.
  • Matching variables: GDP per capita, population, regime type, baseline crisis rate.

Data sources: Wellbeing Economy Alliance (WEAll) case studies, national statistics offices, EM‑DAT disaster database, V‑Dem.

Test: Matched case‑control design. For each treatment unit, select 2–3 control units matched on pre‑period characteristics. Compare crisis counts in excluded dimensions during the post‑implementation window using conditional Poisson regression.

Falsification: No significant difference in crisis frequency, or treatment units perform worse.


H.5 Prediction 5: Value Audits and Gap Reduction

Prediction: Organizations (e.g., municipal governments) randomly assigned to implement annual structured value audits will, over a 3–5 year period, (a) add more dimensions to their explicitly tracked objectives and (b) experience fewer “unexpected” adverse events (budget overruns, service delivery failures not anticipated by existing indicators) than control organizations.

Variables:

  • Treatment: Random assignment to value‑audit protocol (structured review of objective dimensionality, emerging disturbance dimensions).
  • Dependent 1: Change in number of independent tracked performance indicators.
  • Dependent 2: Count of unanticipated adverse events (operationalized as events not predicted by existing indicators within the planning cycle).

Data sources: Municipal administrative data, own data collection via intervention.

Test: Randomized controlled trial with difference‑in‑differences specification for continuous outcomes and Poisson regression for count outcomes.

Falsification: No significant treatment effect on either outcome.


H.6 Prediction 6: Goodhart–Ashby Simulator Calibration

Prediction: In 3–5 well‑documented historical cases of metric‑fixation collapse, a calibrated version of the Appendix C value‑function collapse simulator will produce out‑of‑sample predictions of the collapse trajectory that outperform a naive extrapolation model (e.g., linear trend, ARIMA).

Variables:

  • Simulator parameters: α (productivity of the tracked dimension from the excluded dimension), β (cost of optimizing the metric to the excluded dimension), γ (regeneration rate), η (delayed damage), estimated from pre‑collapse data.
  • Dependent: Out‑of‑sample root mean squared error (RMSE) for the collapse trajectory.
  • Baseline comparator: ARIMA or linear trend fit to pre‑collapse data, projected forward.

Data sources: Historical time‑series for metric and excluded dimension (e.g., waiting‑time targets and clinical outcomes in NHS hospitals; test scores and learning outcomes in education systems; fishery catch quotas and stock biomass).

Test: For each case, fit both models to pre‑collapse data, project the collapse period, compute RMSE. Compare using a simple sign test across cases (how many cases does the simulator outperform the baseline?).

Falsification: The simulator does not outperform the naive model in a majority of cases.


H.7 Prediction 7: Representation Chain Depth and Democratic Satisfaction

Prediction: Democracies with effective representation chains exceeding 2–3 layers will exhibit significantly lower citizen satisfaction with democracy and weaker preference‑policy congruence than those with shorter chains, controlling for economic performance.

Variables:

  • Independent: Effective representation chain depth (federal/unitary × bicameral/unicameral × number of elected tiers).
  • Dependent 1: Mean democratic satisfaction (ESS, CSES).
  • Dependent 2: Preference‑policy congruence (estimated from CSES or replication of Gilens & Page methodology for non‑US cases).

Data sources: European Social Survey, Comparative Study of Electoral Systems, World Values Survey, institutional structure coding from V‑Dem or Comparative Political Data Set.

Test: Two‑group comparison: shallow‑chain (≤2 effective layers) vs. deep‑chain (≥3 layers) democracies. t‑test on mean satisfaction and congruence. Regression with democratic satisfaction as outcome, layer count as predictor (categorical: 1‑2 vs. 3+), and GDP per capita and electoral system type as controls. Test for a threshold effect at the 2‑3 layer boundary rather than a linear relationship.

Falsification: No significant difference in satisfaction or congruence between shallow‑ and deep‑chain groups, or deep‑chain systems show higher satisfaction.


H.8 Research Priority Ordering

Predictions are ordered by feasibility of near‑term testing:

  • Feasible now (secondary data analysis): Predictions 1, 4, and 7 (cross‑sectional, using existing datasets and heuristic G estimation).
  • Feasible with moderate investment: Predictions 2 and 3 (longitudinal data compilation and within‑case time‑series analysis).
  • Requires new data collection: Predictions 5 and 6 (RCT for value audits; simulator calibration requiring detailed case‑specific parameters).

The framework’s empirical credibility will be built incrementally, starting with cross‑sectional tests that can be conducted using existing data and heuristic operationalizations, and progressing toward more demanding designs as initial results warrant.

Share this

GitHub Discord E-post RSS Feed

Built with open source and respect for your privacy. No trackers. This is my personal hub for organizing work I hope will outlive me. All frameworks and writings are offered to the commons under open licenses.

© 2026 Björn Kenneth Holmström. Content licensed under CC BY-SA 4.0, code under MIT.