The Four-Year Ramp
Legislative production and the electoral clock in the Swedish Riksdag, 2002–2026
Draft 3 — all figures from Riksdagens öppna data, 24 riksmöten, 5,715 propositions.
Abstract
Swedish election campaigns are argued in part over governing capacity: which constellation can legislate, at what tempo, with what force. This paper tests those claims against the full open-data record of the Riksdag from 2002 to 2026 — six electoral mandates, 5,715 government propositions with chamber outcomes at förslagspunkt resolution.
Legislative volume is governed almost entirely by position in the electoral cycle. Output rises from a mean of 155 non-budget propositions in a mandate's first riksmöte to 268 in its fourth, a 73% increase accounting for 82.4% of all variance. Mandate identity — which absorbs government composition, historical period, and any secular drift together — accounts for 1.4%. The year-four surge is not queue-clearing: the additional propositions are no smaller, and the chamber absorbs them with no increase in processing time.
The end-of-term surge itself is well documented in the political legislation cycle literature, which interprets it as vote-seeking behaviour by incumbents. Its invariance across mandates is harder to reconcile with that mechanism.
Two of the four production measures have demonstrated sensitivity — each resolves a large effect elsewhere in the same data — so their failure to detect mandate effects is informative rather than a power failure. The single detectable deviation in twenty-four years is riksmöte 2021/22, when the proposition rejection rate rose roughly fourfold during the collapse of the Löfven III / Andersson government. That result survives four separate tests for coverage artefacts.
The paper does not claim that governments are interchangeable. It claims something narrower: on the parliamentary throughput measures the Riksdag records, the calendar and acute governmental crisis are visible, and mandate identity is not.
1. Introduction
Swedish election campaigns routinely turn on claims about governing capacity. Handlingskraft, reformtempo, regeringsduglighet — the vocabulary presumes that different constellations would produce different amounts of legislation at different speeds with different success. These are empirical claims about the production characteristics of a legislature, and they are testable.
The Riksdag publishes every document with structured metadata: submission dates, committee referrals, chamber decisions, and — in the dokforslag block — the outcome of every individual förslagspunkt, coded as bifall, delvis bifall, or avslag. Twenty-four riksmöten of this material covers six electoral mandates spanning nearly every parliamentary arrangement modern Sweden has produced.
Legislative volume follows a four-year ramp. That pattern is already established in the political legislation cycle literature (§1.1) and is expected in a PR system. What is not established, and what this paper reports, is that the ramp is essentially identical across every mandate observed, that the additional output is neither smaller nor more slowly processed, and that rejection rates are constant except during one riksmöte of governmental collapse.
A note on scope before anything else. The dependent variable throughout is parliamentary throughput — propositions submitted, their size, the time the chamber takes over them, and whether it approves them. This is not policy productivity, not reform magnitude, and not policy effect. Adjacent literatures measure those, and a null here does not contradict a positive finding there.
1.1 Related work
Political legislation cycles
The pattern documented in §4 is not new. A literature in political economy, running under the heading political legislation cycles (PLC), has established that legislative output rises toward the end of an electoral term. Lagona and Padovano (2008) set out the theory and the first tests; Padovano and Sy (2026) provide a panel test covering twenty electoral democracies from the mid-1970s onward, finding that the number of laws falls at the start of a legislature and rises significantly near its end, typically in the final six months. Country studies replicate the pattern in the Czech Republic (Brechler and Geršl 2014), in semi-presidential France (Gavoille and Padovano 2017), and for decree production in Italy (Dattilo and Padovano 2025).
Two features of that literature bear on the Swedish case. First, Padovano and Sy find cycle magnitude conditional on institutional design, with PR systems producing substantially larger cycles than majoritarian ones. Sweden is PR, and the ratio observed here — 1.73 from first to fourth riksmöte — is consistent with that expectation. This paper does not claim to discover the cycle.
Second, and more consequentially, PLC theory attributes the pre-election peak to opportunistic behaviour: incumbents adopt vote-maximising strategies as elections approach, and the cycle is read as evidence of dynamic inefficiency in the agency relationship between voters and politicians. That interpretation makes predictions this paper can test, because the existing evidence is cross-country while the variation here is within-country under a constant constitutional framework.
Three of those predictions fail:
- Magnitude should vary with electoral incentive. A government facing likely defeat, or a fragile coalition needing to demonstrate output, has more to gain from a pre-election surge than a secure one. Across six Swedish mandates — including one parliamentary majority, one caretaker period, and one government that collapsed mid-mandate — mandate identity explains 1.4% of variance in output (§4).
- Pre-election legislation should be cheaper. Vote-seeking output predicts more numerous, smaller, more visible instruments. Year-four propositions are marginally larger on förslagspunkter (§4.1).
- A deliberate surge should strain processing. Median latency is flat across all four year-positions and the 90th percentile falls in year four (§4.2).
An administrative account fits the same data more comfortably: if the utredning–remiss–beredning pipeline has a characteristic duration, work initiated early in a mandate matures late in it, and the ramp is a transit property of the pipeline rather than a strategy of the government moving through it. This paper cannot adjudicate between the accounts — §10 sets out the measurement that would — but the invariance narrows the space the opportunistic account has to occupy.
Government type and legislative performance
A separate literature asks whether minority and coalition governments legislate less effectively than majority ones. Strøm (1984, 1990) established that minority cabinets are rational solutions rather than pathologies and are not straightforwardly less successful. Later large-N comparative work finds that minority cabinets do not generally underperform, and that what matters is whether legislative support is formalised — formal minority cabinets operating in practice much like executive coalitions. Work on coalition agreements and policy-making productivity finds effects conditional on cabinet type, though measured on economic reform output rather than on parliamentary throughput.
The Swedish period covers a single-party minority with informal support, a majority coalition, a minority coalition, two different formalised cross-bloc arrangements (Decemberöverenskommelsen, Januariavtalet), and a written support contract with staff embedded in Regeringskansliet (Tidöavtalet). Formalisation predicts that the contracted arrangements should perform comparably to the majority government. They do — but so does the informally supported single-party minority. The distinction does not register in throughput.
The one exception is consistent with the mechanism read at higher resolution: the rejection-rate spike of 2021/22 (§6) occurs precisely when a formalised arrangement had ceased to function.
Composition over the cycle
On what governments legislate about, the relevant work concerns intra-term dynamics rather than partisan difference. Studies of German parliamentarians find legislative priorities shifting across the electoral cycle, and work on coalition governments' strategic timing finds the middle of a term used as a window for controversial legislation. Both imply that when within a term is a live variable for composition — which the design in §7 does not model, and which may be part of why bloc effects were not recoverable there.
The Swedish case
Sweden appears in comparative panels but has not, so far as I can establish, been examined at the resolution the open-data record permits: förslagspunkt-level chamber outcomes across every government proposition for twenty-four years. The contribution is that resolution and the within-country design it supports.
2. The Swedish case
The period 2002–2026 supplies unusually varied parliamentary conditions within a constant constitutional framework:
| Mandate | Arrangement |
|---|---|
| Persson II (2002–06) | S single-party minority, V and MP support |
| Reinfeldt I (2006–10) | Four-party majority coalition |
| Reinfeldt II (2010–14) | Four-party minority coalition |
| Löfven I (2014–18) | S+MP minority, Decemberöverenskommelsen |
| Löfven II/III + Andersson (2018–22) | S+MP minority, Januariavtalet, then collapse |
| Kristersson (2022–26) | M+KD+L minority, Tidöavtalet with SD |
These are electoral mandates, not governments in the formal sense. The 2018–2022 mandate contains three distinct governments under standard classification (Löfven II, Löfven III, Andersson); the grouping here follows the electoral cycle because that is the unit the analysis is about. Where the distinction matters — and in §6 it matters decisively — the riksmöte rather than the mandate is the unit of analysis.
The period includes one parliamentary majority, one four-month caretaker government, one pandemic, three prime ministers inside a single mandate, and two formal cross-party governing contracts of different design. If parliamentary arrangement affects legislative production, the variation required to detect it is present.
3. Data and construction
All data come from Riksdagens öppna data via the dokumentlista and
dokumentstatus endpoints. The unit of time is the riksmöte; mandates group
four riksmöten each.
Four measures:
- Volume — government propositions per riksmöte.
- Latency — days from proposition date to chamber decision, taken from the handling betänkande where the decision is not recorded on the proposition itself.
- Instrument size — förslagspunkter per proposition.
- Success — share of propositions with at least one förslagspunkt rejected by the chamber.
All four are properties of parliamentary throughput. None measures the substantive weight, ambition, or effect of what passes.
3.1 Population statement
Measures 2–4 are computed on non-budget propositions that reached a betänkande with a förslag block: 3,658 of 5,715 cached propositions. This restriction is not incidental and should not be read as a sample of all propositions.
Budget propositions are decided by rambeslut rather than punkt by punkt, and consequently carry förslag blocks at 17.1% against 73.1% for ordinary propositions (Fisher OR = 0.08, p < 1e-200). The budget family is also registered as one document per utgiftsområde, so a single budget proposition appears as roughly twenty-seven documents — and the number so registered shifted from about 42 per year to about 11 during 2017/18–2020/21 through a change in titling convention, not in budgeting. Budget documents are therefore excluded from all measures, and volume results are reported both ways.
3.2 A measure discarded
Partial approval (delvis bifall) falls monotonically from 18.1% of propositions in 2002–06 to 2.7% in 2022–26. This is not a finding. Mean förslagspunkter per proposition rises over the same period, and the two correlate at Spearman −0.75 across the twenty-four riksmöten: registrars progressively stopped coding partial approval and began splitting punkter instead. The measure records registration practice and is dropped.
4. The electoral ramp
The existence of an end-of-term surge is expected (§1.1). What follows concerns its magnitude, its invariance, and what it is made of.
Decomposing proposition counts across the 6 × 4 grid of mandates and year-positions:
| Source | SS | df | Share |
|---|---|---|---|
| Mandate identity | 735.7 | 5 | 1.4% |
| Year-in-mandate | 42,450.5 | 3 | 82.4% |
| Interaction | 8,314.8 | 15 | 16.1% |
Year-in-mandate means, non-budget propositions: 155 → 182 → 211 → 268, a ratio of 1.73. Mandate means span 227 to 245 — eight percent, across every arrangement listed in §2.
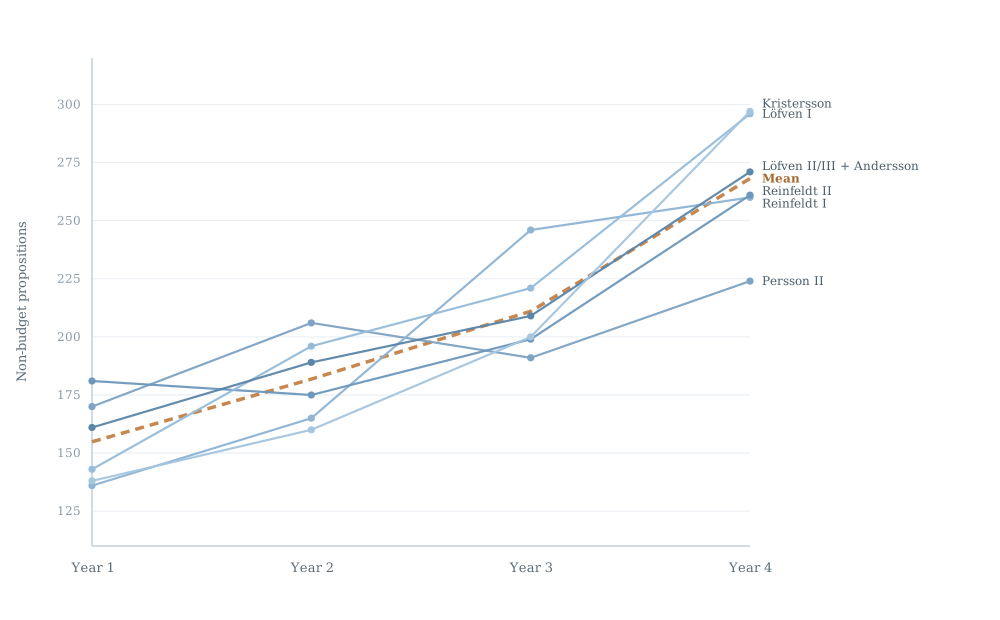
Figure 1. Non-budget propositions per riksmöte, plotted by position within the electoral mandate. Each line is one mandate; the dashed line is the mean across all six. Four of the six rise monotonically; Persson II dips at year three and Reinfeldt II at year two. Every mandate nonetheless ends substantially above where it began, and the six lines occupy a narrow band relative to the spread from year one to year four.
Note what mandate identity contains. It is a six-level block variable absorbing government composition, parliamentary arrangement, historical period, secular drift in legislative practice, and any period-specific shock simultaneously. It is not a party variable, and the 1.4% figure should not be read as isolating a partisan effect. The confound runs in a convenient direction, however: since mandate absorbs more than party, a pure party variable could only explain less. What the decomposition establishes is that everything distinguishing one four-year block from another explains very little about how much the Riksdag produces.
4.1 The surge is not queue-clearing
The obvious deflationary reading is that year-four output is thin: minor amendments and technical instruments cleared from a backlog before dissolution. It is not. Median förslagspunkter per proposition by year-position runs 1, 1, 1, 2, and the mean runs 3.0, 2.9, 3.1, 3.7. Year-four propositions are marginally larger, so the ramp represents roughly double the legislative content of a mandate's first year on any weighting.
4.2 The chamber absorbs it without additional delay
Median latency by year-position: 72, 72, 72, 71 days. The 90th percentile falls in year four, from 155 to 140 days.
A 73% increase in arrival rate producing no increase in processing delay is not the signature of a saturated queue. Several readings remain open. Chamber capacity may carry substantial slack at the observed load; capacity may be adjusted seasonally or in batches; or the measured interval may be dominated by procedural stages — motionstid, remissrunda, utskottsberedning — whose durations are set by rule rather than by load, in which case latency is not a queueing quantity at all.
The conservative statement is therefore: nothing in these data indicates that chamber processing capacity binds under the observed load. That is weaker than a claim about where the constraint lies, and it is what the evidence supports.
4.3 Amplitude: an artefact, not a trend
Cycle amplitude appears to grow across the series when all propositions are included: year-4/year-1 ratios of 1.20, 1.72, 1.32, 1.72, 1.89, 1.92, with a log-scale linear-by-linear interaction at F(1,14) = 8.28, p = 0.012.
Excluding budget documents, it does not. The ratios become non-monotone (1.32, 1.91, 1.44, 2.07, 1.68, 2.15), Tukey's non-additivity test returns p = 0.557, the linear-by-linear term p = 0.063, and a permutation test on the six ratios p = 0.18.
Budget documents are precisely where the registration conventions of §3.1 shifted. The apparent amplitude trend is therefore most plausibly registrar behaviour rather than legislative behaviour, and is not claimed here. A lengthening beredning pipeline would produce exactly this growing amplitude, which makes its absence a mild negative result for that mechanism.
On the design: with one observation per cell, a saturated interaction consumes all fifteen residual degrees of freedom. The quantity labelled "interaction" above is the interaction; there is no independent error term, and conventional interaction F-tests do not exist in this layout. The one-degree-of-freedom tests above are the available substitutes.
5. Instrument sensitivity
Four null results invite the objection that the instruments are blunt. Rather than validate against an external measure, I pair each null with a large effect the same measure detects in the same units.
Volume resolves the year-in-mandate effect at F(3,15) = 25.5, 82.4% of variance. A measure with that resolution is not blind. Against it, mandate returns F = 0.27 — between-mandate variation is smaller than the within-mandate residual. This is a statement about effect size, not a failure of power: an F below one indicates that grouping by mandate explains less than an arbitrary partition of the same data would be expected to.
Success rate resolves riksmöte 2021/22 at OR = 4.55, Fisher p = 3.7e-05, while the remaining twenty-three riksmöten are homogeneous to χ² = 13.4 on 22 df, p = 0.92. The measure finds a real deviation where one exists.
Latency and instrument size have no such validation. They are reported descriptively in §4; no null is claimed for them.
6. What happened in 2021/22
Proposition rejection rates by mandate (≥1 punkt rejected, Wilson 95% CI):
| Mandate | k/n | Rate | CI |
|---|---|---|---|
| Persson II | 7/570 | 1.23% | 0.60–2.51 |
| Reinfeldt I | 8/643 | 1.24% | 0.63–2.44 |
| Reinfeldt II | 9/575 | 1.57% | 0.83–2.95 |
| Löfven I | 10/641 | 1.56% | 0.85–2.85 |
| Löfven II/III + Andersson | 22/636 | 3.46% | 2.30–5.18 |
| Kristersson | 4/593 | 0.67% | 0.26–1.72 |
The overall χ² across mandates is significant (17.7, df 5, p = 0.003), and it is entirely one cell. The 2018–22 mandate against the other five pooled: OR = 2.81, Fisher p = 0.0004. Remove it and the remaining five are indistinguishable: χ² = 2.54, df 4, p = 0.64. Kristersson against the other four: p = 0.22 — nothing.
But the mandate is the wrong unit, which is exactly why §2 declines to treat it as a government. Within 2018–22 the rejections run 3, 3, 3, 13 across the four riksmöten. The final year alone gives 5.94% against 1.37% for every other riksmöte in the series (OR = 4.55, p = 3.7e-05). Excluding it, the mandate falls to 2.16% against 1.26%, p = 0.17.
2021/22 is the riksmöte in which Löfven resigned, Magdalena Andersson was elected prime minister and left office the same day following Miljöpartiet's exit from government, was subsequently elected again, and governed on a budget written by the opposition. A government losing votes at four times the ordinary rate under those conditions is not a finding about governing arrangements. It is a description of a government coming apart — and the anomaly attaches to the government, not to the mandate that contains it.
6.1 The coverage threat, tested four ways
Because förslag-block coverage varies across the series (59.8%–70.7% by mandate) and correlates with rejection rate at the mandate level (rho = 0.71, n = 6), the 2021/22 result could in principle be an artefact of that riksmöte being well covered. Four tests:
- Riksmöte-level regression. Across all 24 riksmöten the coverage–rejection correlation is +0.04 — essentially zero. The mandate-level rho of 0.71 was an artefact of aggregating twenty-four observations to six. 2021/22 remains the extreme value on the coverage-adjusted residual at z = +3.31.
- Coverage-matched peers. Against the thirteen riksmöten within ±3pp of its coverage: 4.41% vs 0.85%, OR = 5.38, p = 0.0003.
- Mantel–Haenszel by coverage tercile. OR = 8.71, p < 0.0001.
- Tipping-point bounds. For coverage to explain the result, the 1,302 unobserved propositions in the other riksmöten would need a rejection rate of 13.41% — 15.3 times their observed rate of 0.88%. Counting every uncovered proposition as undefeated everywhere, the most pessimistic possible recount, still leaves OR = 5.43, p = 1.7e-04.
The fourth test is the one that settles it. The first three can only fail to find a confound; the fourth states how implausible the confound would have to be.
7. Composition: unresolved
If mandates do not differ in how much they legislate, they might still differ in what they legislate about. I could not resolve this, and report the attempt rather than a null.
Because mandates are contiguous blocks of calendar time, any secular drift in policy attention registers as a mandate effect with no party content. The test must therefore be on bloc, which alternates S–M–S–M and is not collinear with time, after removing a linear trend from each series.
| Representation | Bloc variance share | Median p | Time share |
|---|---|---|---|
| Committee (utskott) shares | 5.2% | 0.167 | 13.6% |
| Title topics, TF-IDF | 3.7% | 0.417 | 19.4% |
| Title topics, KB-SBERT | 3.0% | 0.729 | 14.7% |
Committee shares were restricted to the twelve utskott present across all 24 riksmöten; LU was abolished in 2006 and CU created in its place, so their apparent bloc effects were existence windows correlating with bloc. Title topics had digits stripped, since year tokens otherwise cluster documents by riksmöte, and 708 recurring administrative propositions were excluded by a rule stated in advance — treaty ratifications, annual reports, deployment renewals — leaving 4,178 of 4,894.
Bloc variance shares are stable across k = 10–40 and five clustering seeds, ranging 3.1–4.8% with standard deviations under 1.5pp. The associated p-values are not stable: they range from 0.08 to 1.00 across the same sweep. That instability is itself the clearest illustration of the design's limit. Bloc is constant within a riksmöte, so effective n is 24 regardless of 4,178 documents; the circular-shift null admits 23 labellings, the minimum achievable p is 0.042, and the statistic therefore takes a handful of discrete values that move sharply under trivial changes to the partition while the effect size does not. Large document counts create no statistical power when the treatment variable changes only twenty-three times.
Why era and party cannot be separated here is visible in the topics themselves. Under both vectorisations the highest bloc-variance cluster is health care and covid — +1.45pp under S-led mandates in the SBERT solution — which is the pandemic falling inside an S-led window. Committee data show the same pattern: JuU runs +3.15pp under S-led, coinciding with the gang-violence escalation of 2015–2022, but the M-led mandate of 2022–26 legislated heavily on crime as well.
Time explains 14–19% of composition variance against bloc's 3–5%. Content appears to track the era more than the government, but that is an observation, not a tested claim. Two unrelated representations agreeing at 3–4% suggests the limitation is the design rather than the vectoriser.
8. Threats to validity
Coverage. Addressed at §6.1 for the 2021/22 result. The riksmöte-level correlation of +0.04 suggests coverage is close to random with respect to contentiousness, but the mechanism generating missing förslag blocks is not established.
Registration practice. Three convention changes were detected and handled: budget document counts (§3.1), partial-approval coding (§3.2), and year tokens in titles (§7). Others may remain undetected. Any longitudinal claim from this source needs the same scrutiny — the amplitude result of §4.3 is a worked example of a finding that did not survive it.
Right-censoring. Riksmöte 2025/26 was incomplete at extraction. Volume may rise further; latency is biased low. The 2022–26 rejection rate is stable across three specifications (0.66%, 0.53%, 0.67%), so censoring is not driving it.
Effective sample size. Every mandate- or bloc-level claim runs on 24 observations. Where a result depends on that layer, this is stated.
Selection on submitted propositions. See §9.
9. What this does not show
Nothing about quality, magnitude, or outcomes. A constant rate of legislation says nothing about whether the legislation is good, ambitious, or effective. Parliamentary throughput is not policy productivity, and a null here is not in tension with literatures reporting government-type effects on reform output.
Nothing about composition. §7 is inconclusive in both directions.
Nothing about any single government. Mandate identity is a block variable, and the 2022–26 mandate is unremarkable on every validated measure. That is a finding about the measures, not a verdict on a government.
Anticipatory adaptation is structurally invisible, and this is the deepest limitation. Governments do not submit propositions they expect to lose. A government skilled at building majorities and a government too timid to test one produce identical rejection rates by opposite routes. What the record contains is the residual after adaptation: bills never drafted, provisions softened in negotiation with a support party, ideas killed at the departementspromemoria stage leave no trace in any document the Riksdag publishes.
This is a general property of institutional measurement rather than a quirk of this dataset. The measurement channel preferentially records realised failures and is structurally blind to avoided ones. Any evaluation built on the observable record inherits that blindness, including this one.
10. Implications
For evaluation. Grading a mandate on reformtempo measures the calendar. Any comparison of governments on legislative output that does not condition on year-in-mandate is measuring the electoral clock and attributing it to parties.
For institutional design. If throughput is insensitive to which mandate is in progress and to chamber load, the variables that would move it lie upstream of the chamber — in Regeringskansliet's utredning capacity, the remiss cycle, and committee procedure. This paper does not establish that those are binding, only that nothing in the parliamentary record suggests parliament is.
The test that would settle the mechanism. §1.1 set out two competing accounts of the end-of-term surge: the opportunistic one the political legislation cycle literature assumes, in which governments release legislation before elections to maximise votes, and an administrative one in which the ramp is a transit property of a pipeline with a characteristic duration. The invariance results above sit awkwardly with the first but do not establish the second. One measurement discriminates between them. If the ramp is pipeline transit, propositions arriving in year four were initiated earlier and should show systematically longer lags from SOU to proposition than those arriving in year one. If it is strategic release, the lag distribution should be similar across year-positions and the difference should lie in when completed work is published rather than when it was begun. The lag is extractable from the same source, since propositions cite the SOU they descend from, and is the natural next step for this line of work.
For the study of political attention. A system can exhibit large political variation while the variable elections turn on explains very little of the variance in the observable production process. Position in the electoral cycle produces a large effect; mandate identity a small one; acute institutional breakdown a large but tightly localised one; and policy composition remains undetermined. That hierarchy is not what the campaign vocabulary predicts.
Appendix: reproduction
All analysis runs from Riksdagens öppna data with no other source. Pipeline: document listing and status extraction, budget-family exclusion, förslagspunkt outcome normalisation, and the tests reported above. Scripts, derived tables, and the API response cache as of [extraction date] are available at [repository].
Sources: Sveriges riksdag, öppna data (fri användning, ange källa).
References
[To verify against originals before publication.]
- Brechler, J. & Geršl, A. (2014). Political legislation cycle in the Czech Republic. Constitutional Political Economy 25(2), 137–153.
- Dattilo, M. & Padovano, F. (2025). The cycles of decrees: evidence from the Italian Parliament. European Journal of Law and Economics 59(1), 133–178.
- Gavoille, N. & Padovano, F. (2017). Legislative cycles in a semipresidential system. Journal of Institutional and Theoretical Economics 173(3), 470–497.
- Lagona, F. & Padovano, F. (2008). The political legislation cycle. Public Choice 134(3), 201–229.
- Padovano, F. & Sy, Y. (2026). Conditional political legislation cycles. International Review of Law and Economics 85.
- Strøm, K. (1984). Minority governments in parliamentary democracies. Comparative Political Studies 17, 199–227.
- Strøm, K. (1990). Minority Government and Majority Rule. Cambridge University Press.